The biotech industry marked all-time highs in February 2021. Since then, it has fallen precipitously – first in a biotech correction for the remainder of 2021 and then in a broader market correction in the first half of 2022. Many have speculated on where we are in the correction and how much more biotech can or should recede before we reach nadir. For example, recently, our industry peers at RA Capital published an opinion piece juxtaposing the breadth and depth of this drawdown to previous drawdowns1. Additionally, some of our sell-side friends compared the theoretical capacity of Big Pharma balance sheets to the sum of development-stage biopharma enterprise values to opine on the relative value of the industries versus previous time periods. We believe both are descriptively interesting and worth review, though both fall short in explaining particulars of this correction.
At Driehaus, we anchor our understanding of the movement of markets in the concept of changing supply and demand. It sounds simple, and indeed it is in concept, but we find the mastery of the application of the concept to markets to be rare. To do so, one must conceptualize, contextualize, prioritize, and synthesize many potential perspectives into a hypothesis or hypotheses for what is upsetting the balance of supply and demand in the market. It requires mental dexterity, open-mindedness, humility, endurance, attention to detail, and an understanding of how market participants act. We believe this way of thinking can be taught but requires years of study and practice – there is no shortcut. This was Richard Driehaus’ genius and gift to us and is a cornerstone of how we think. To understand the movement of this market, we try to identify what changes there may have been in aggregate in the marketplace recently and to understand how they may change moving forward.
Ed Hyman, the founder of Evercore ISI and Head of Economic Research, published a note in early June highlighting M2’s changes since COVID began2. “M2” is a measure of monetary supply in the US economy. It includes currency and coins held by the non-bank public (“M1”) as well as savings deposits, small time deposits <$100k, and shares in retail money market mutual funds. The St. Louis Fed publishes M2 monthly, going back to the 1960s. For much of the last 60+ years, the M2 grew year-over-year in a range between 3-10%. However, since COVID hit in the beginning of 2020, the government grew the money supply at historically unprecedented levels (see all time M2 chart below in Figure 1 below).
Figure 1: US Monetary Supply (M2) Year-over-Year Percent Change, 1960-20223

In his note, Ed Hyman juxtaposed M2 to the consumer price index (CPI) to illustrate the relationship between the two and to hypothesize that, as M2 recedes back to historical levels, the CPI and thus inflation are likely to recede as well.
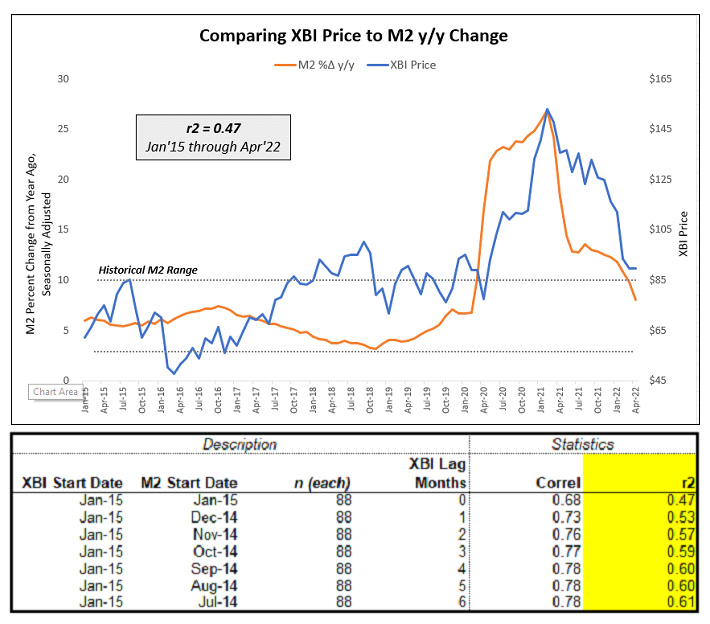
We were intrigued by Ed’s analysis and wondered if there was a similar relationship between M2 and other asset prices – namely, biotech ETF prices. Thus, we plotted the year-over-year change in M2 and the monthly price of the SPDR S&P Biotech ETF XBI, hypothesizing that XBI would to some extent correlate to M2. We found that there was a notable correlation of 0.47 that modestly strengthened as we viewed XBI prices on a lag (see Figure 2 below).
Figure Two: US Monetary Supply (M2) Year-over-Year Percent Change Compared to XBI Price, January 2015-April 2022 (Monthly)

Source: Driehaus Analysis
For us, this analysis proffers an imperfect but directional framework for thinking about where we are in this specific biotech’s drawdown. If some meaningful part of XBI’s leg up in 2020 and subsequent leg down in 2021 and 2022 can be attributed to changes in the money supply, as this analysis suggests, then as M2 growth re-enters historical ranges its influence on XBI price action is likely to recede. Of course, this does not preclude the market from experiencing other macro or industry-level shocks that may continue to tip the balance of buyers and sellers in one direction or another, making it hazardous and likely folly to call a nadir. But we are incrementally heartened based on this analysis that a headwind we have experienced over the past 14 months may be somewhat abating.
1Kolchinsky, “Biotech’s Dulcius Ex Asperis: The Way Through This Downturn,” May 27, 2022. Accessed 6/20/2022 from https://rapport.bio/all-stories/the-way-through-the-biotech-downturn. 2Hyman, “Slides for Eco Video 06-06,” June 6, 2022. Accessed 6/20/2022. 3FRED, Monthly M2 Percent Change from Year Ago, Seasonally Adjusted, June 1960 through April 2022. Accessed 6/20/2022 from https://fred.stlouisfed.org/series/M2SL#0.
This information is not intended to provide investment advice. Nothing herein should be construed as a solicitation, recommendation or an offer to buy, sell or hold any securities, market sectors, other investments or to adopt any investment strategy or strategies. You should assess your own investment needs based on your individual financial circumstances and investment objectives. This material is not intended to be relied upon as a forecast or research. The opinions expressed are those of Driehaus Capital Management LLC (“Driehaus”) as of June 2022 and are subject to change at any time due to changes in market or economic conditions. The information has not been updated since June 2022 and may not reflect recent market activity. The information and opinions contained in this material are derived from proprietary and non-proprietary sources deemed by Driehaus to be reliable and are not necessarily all inclusive. Driehaus does not guarantee the accuracy or completeness of this information. There is no guarantee that any forecasts made will come to pass. Reliance upon information in this material is at the sole discretion of the reader.
Other Commentaries
Driehaus Micro Cap Growth Strategy March 2024 Commentary with Attribution
By US Growth Equities Team
Driehaus Small Cap Growth Strategy March 2024 Commentary with Attribution
By Jeffrey James