It is rare to have a conversation with a company management team or one of our clients, in recent months, without the topic of inflation arising. Few executives or investment professionals have had meaningful experience managing through an inflationary environment, so it is not surprising that the recent increase in various inflation readings is creating a lot of angst and uncertainty. While we are not economists and do not have a firm view on the sustainability of recently elevated inflation measures, the trajectory of inflation will have widespread implications for monetary policy, consumer behavior, and sector leadership in the stock market. Although the Consumer Price Index and Producer Price Index are the most widely watched measures of inflation, other indicators can give investors further insight into the level, trajectory, and behavioral impact of inflation.
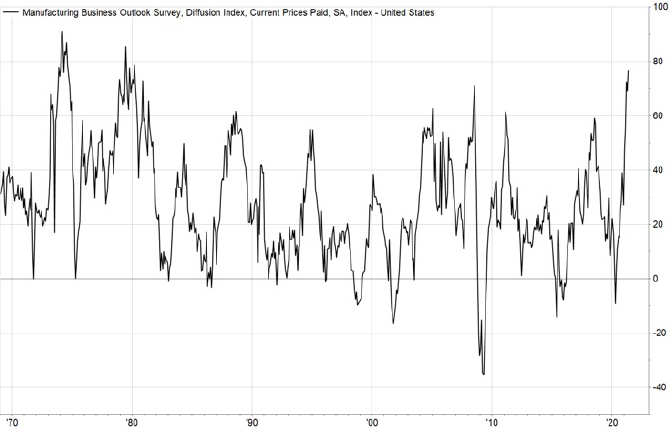
Without a doubt, inflation is top of mind for company managements in numerous industries that are confronting supply chain disruptions, labor shortages, depleted inventories, and rising materials costs, all while demand has recovered at a record pace. Many survey-based measures of inflation, such as those from the Institute of Supply Management, have hit record highs or are approaching levels last seen in the 1970s (Exhibit 1).
Exhibit 1. Manufacturing Business Outlook Survey
Source: FactSet
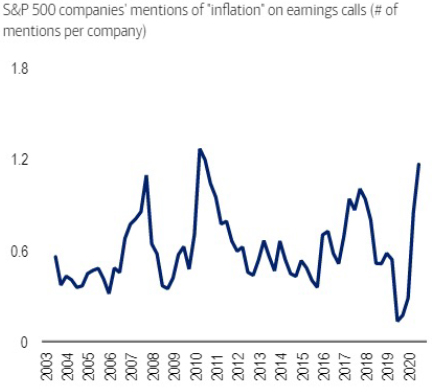
Mentions of the word “inflation” on earnings conference calls have risen to a near record high (Exhibit 2).
Exhibit 2. “Inflation” Skyrocketed to Near Record Highs
Source: BofA Global Research
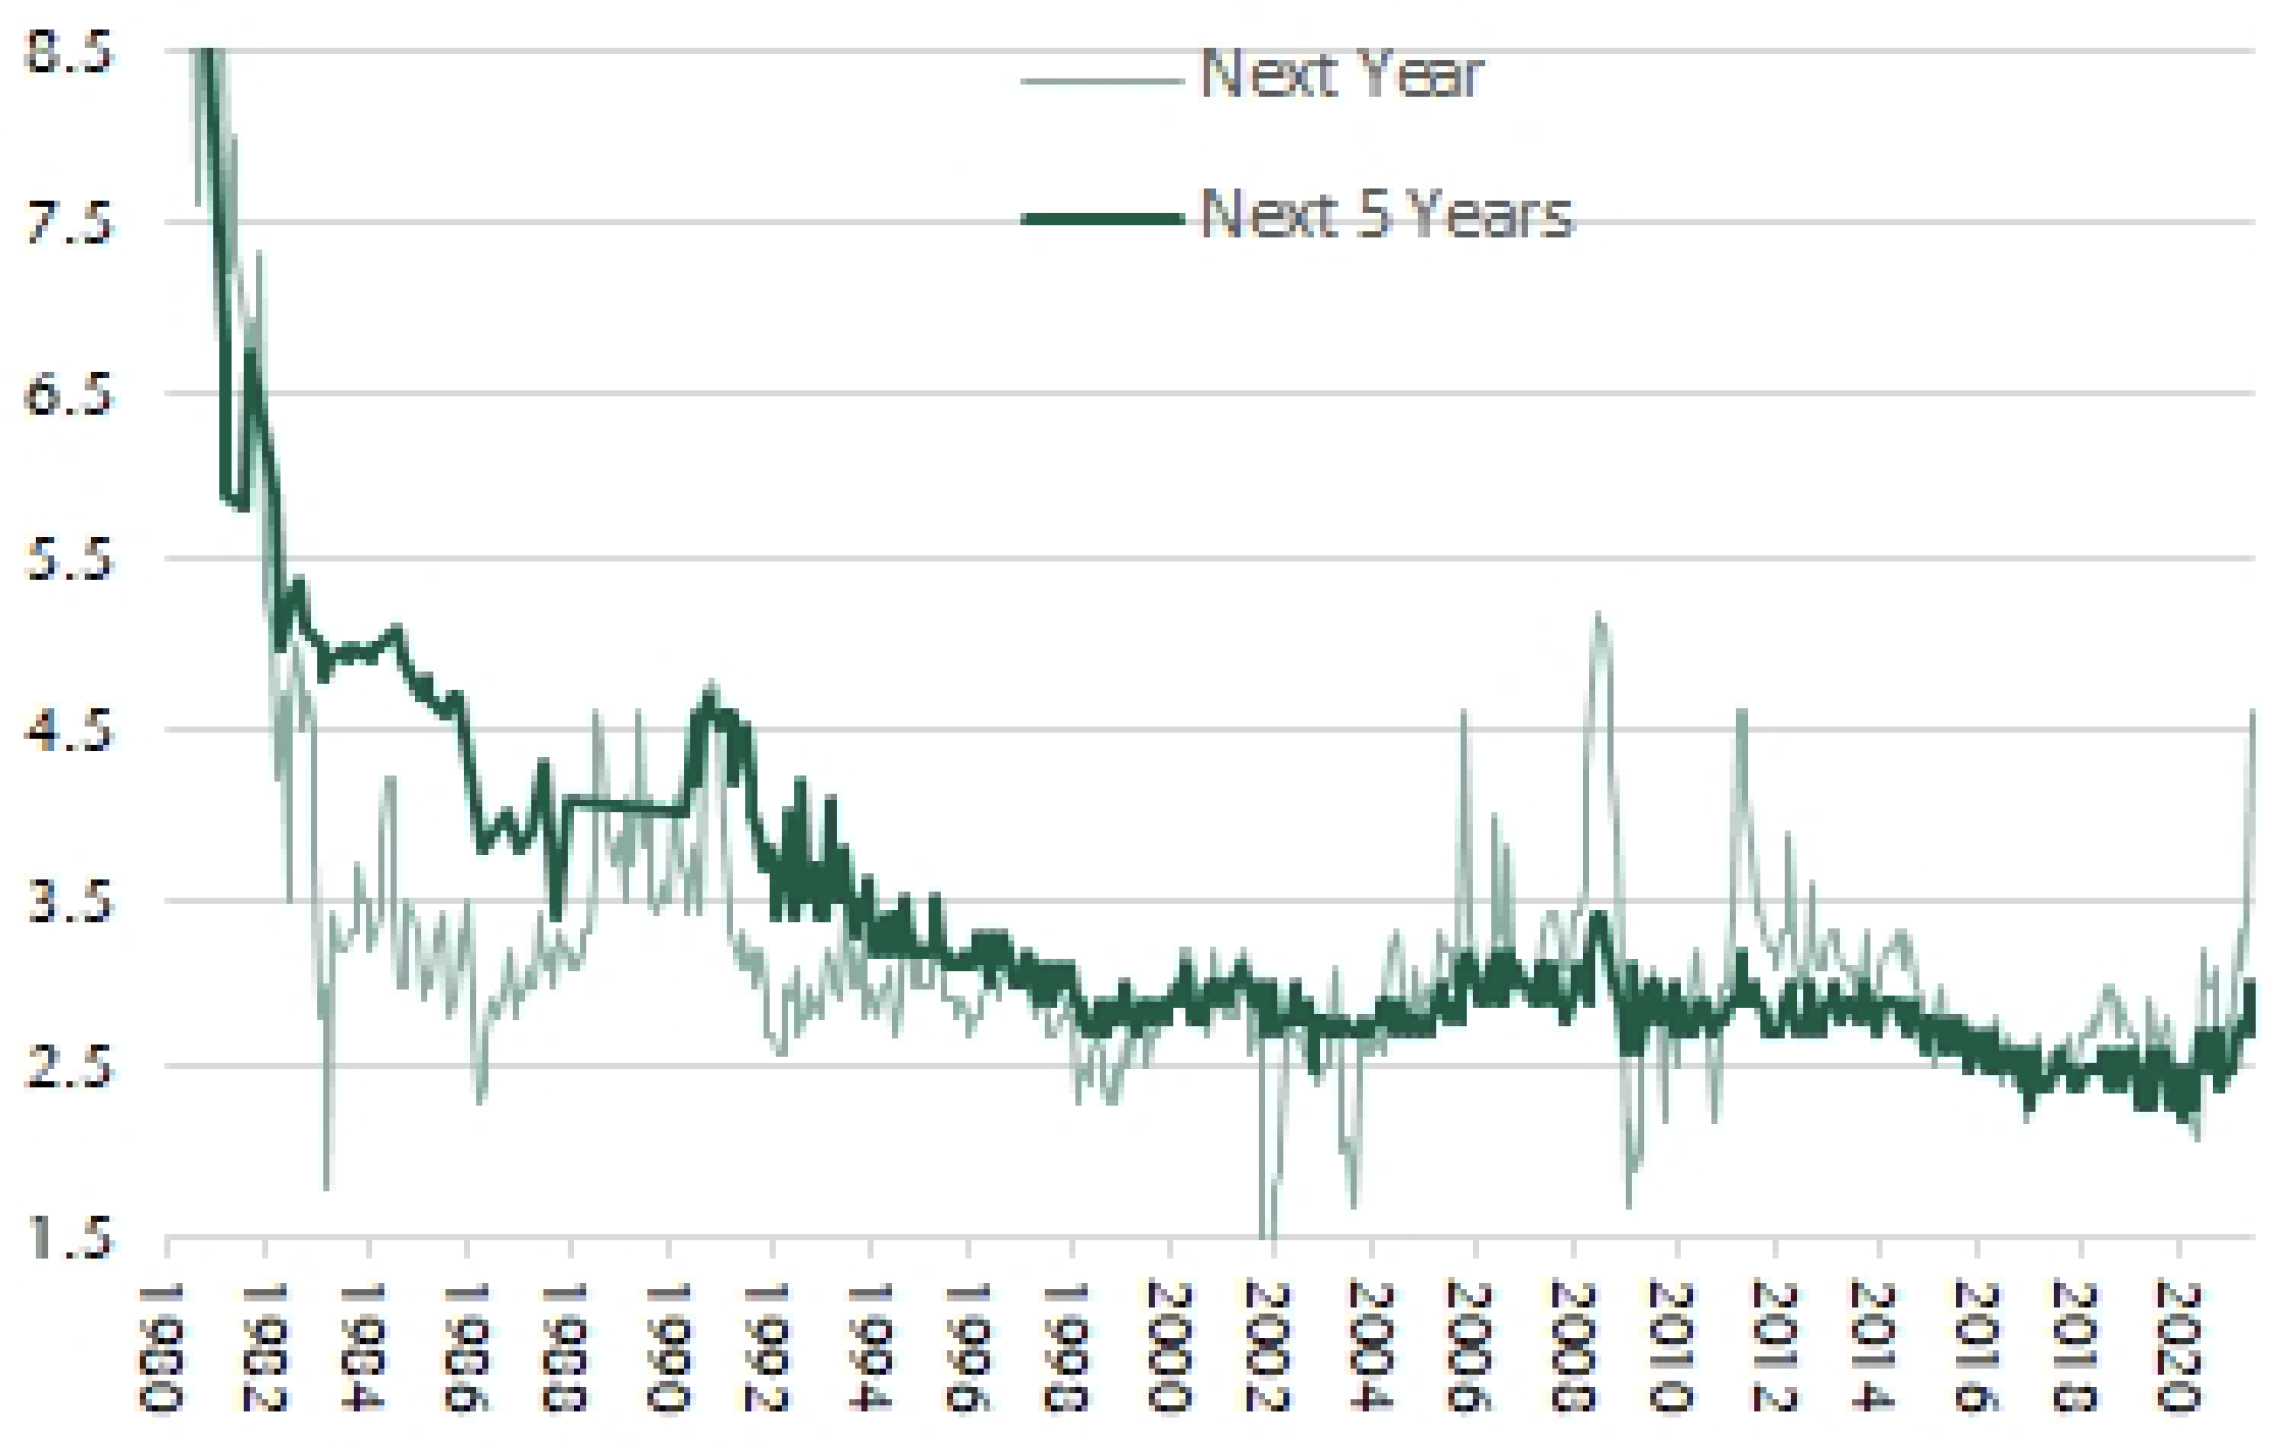
Inflation is also top of mind for consumers as it can have a meaningful impact on savings decisions and purchasing behavior. With companies raising prices to offset rising costs, consumers are seeing prices rise for housing, autos, airline tickets, food, and many other categories of spending. Consumer surveys show that near-term and long-term inflation expectations have risen to levels not seen in years (Exhibit 3).
Exhibit 3. UMich Consumer Inflation Expectations
Source: Haver, JEF Economics
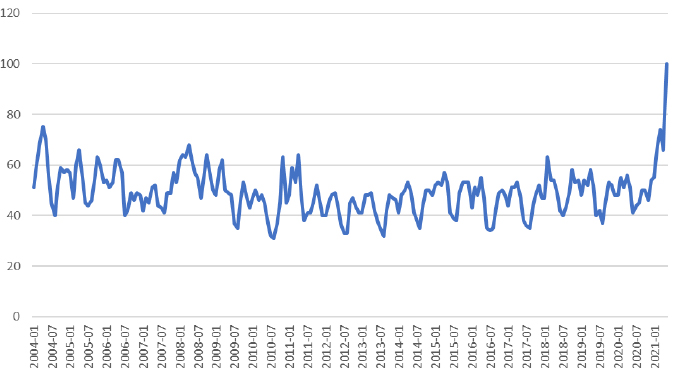
Although there is not as much history for Google search activity, this measure also reflects the increasing awareness of inflation with searches for the term at a record high (Exhibit 4).
Exhibit 4. Interest Over Time for “Inflation”
Source: Google Trends
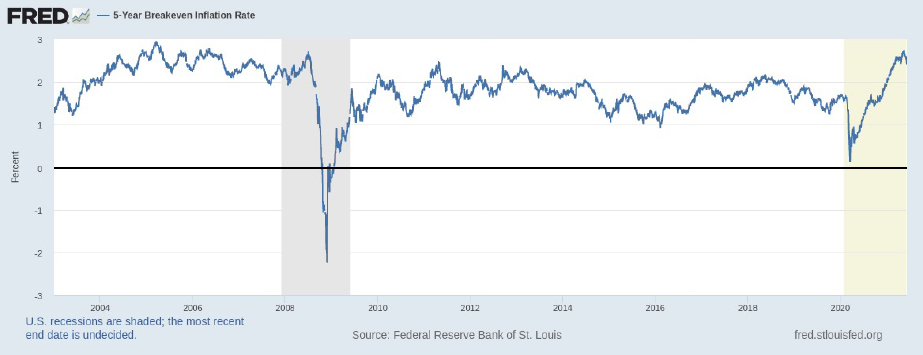
Survey-based inflation measures can be helpful but for real-time insight investors can also monitor what the bond market is pricing in. One common way to calculate the level of inflation embedded bond yields is to take the difference between the yield on 5 or 10-Year Treasuries and the yield on Treasury Inflation Protected Securities, also known as the breakeven inflation rate. Just like the survey-based measures above, the 5-year breakeven inflation rate is at a level not seen for well over a decade Exhibit 5.
Exhibit 5. 5-Year Breakeven Inflation Rate
Source: Federal Reserve Bank of St. Louis
Notably in recent weeks, the 5-year breakeven inflation rate has moderated from a high of 2.7% in mid-May to 2.4%, a level not too far off from the Federal Reserve’s target of 2%. This may reflect increased confidence in the Federal Reserve’s ability to contain inflationary pressures, a nascent decline in some commodity prices such as lumber, efforts by the Chinese government to restrict commodity speculation and the early loosening of supply constraints in some industries. For investors seeking to appropriately position portfolios for either rising or declining inflation, these market-based measures are likely to be the timeliest way to assess where inflation is headed.
This information is not intended to provide investment advice. Nothing herein should be construed as a solicitation, recommendation or an offer to buy, sell or hold any securities, market sectors, other investments or to adopt any investment strategy or strategies. You should assess your own investment needs based on your individual financial circumstances and investment objectives. This material is not intended to be relied upon as a forecast or research. The opinions expressed are those of Driehaus Capital Management LLC (“Driehaus”) as of June 2021 and are subject to change at any time due to changes in market or economic conditions. The information has not been updated since June 2021 and may not reflect recent market activity. The information and opinions contained in this material are derived from proprietary and non-proprietary sources deemed by Driehaus to be reliable and are not necessarily all inclusive. Driehaus does not guarantee the accuracy or completeness of this information. There is no guarantee that any forecasts made will come to pass. Reliance upon information in this material is at the sole discretion of the reader.
Other Commentaries
Driehaus Micro Cap Growth Strategy March 2024 Commentary with Attribution
By Jeffrey James
Driehaus Small Cap Growth Strategy March 2024 Commentary with Attribution
By Jeffrey James