The end of 2018 brought a critical juncture in financial markets. After sniffing out weakening macro data, the US 10-year bond yield fell about 20% in the fourth quarter of 2018 to a low of 2.54%. The drop in interest rates has brought some relief to a negative housing market outlook constrained by low affordability. See Exhibit 1.
Exhibit 1: Mortgage Rates have Pulled Back to Flat Year over Year
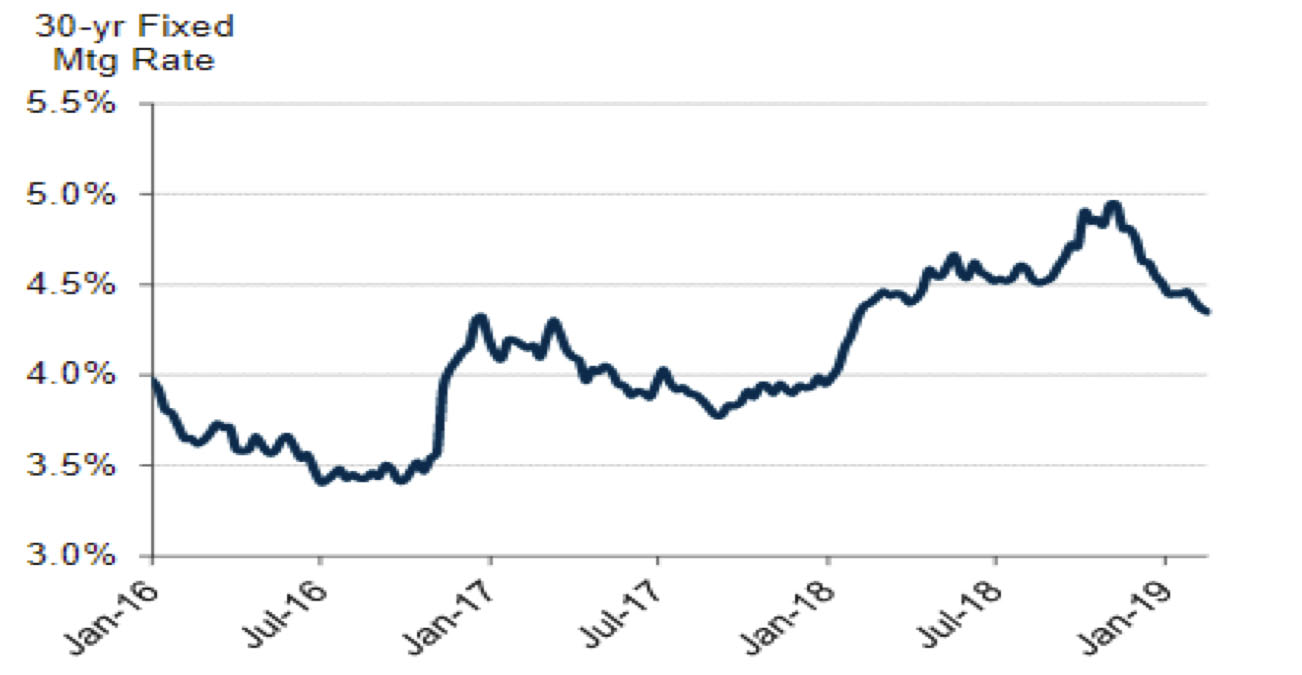
Source: Freddie Mac, Evercore ISI Research
Simultaneously, housing-related stocks began to seemingly front run the potential impact of lower interest rates and in a somewhat seasonal fashion started to outperform during the fourth quarter. Ensuing housing data points were supportive of a brighter outlook. According to the Mortgage Bankers Association estimate, mortgage purchase applications improved in January, up almost 40% from December. See Exhibit 2. Also, pending home sales grew 4.6% month over month in January after declining 2.3% in December.
Exhibit 2: Weekly Mortgage Applications Market Index
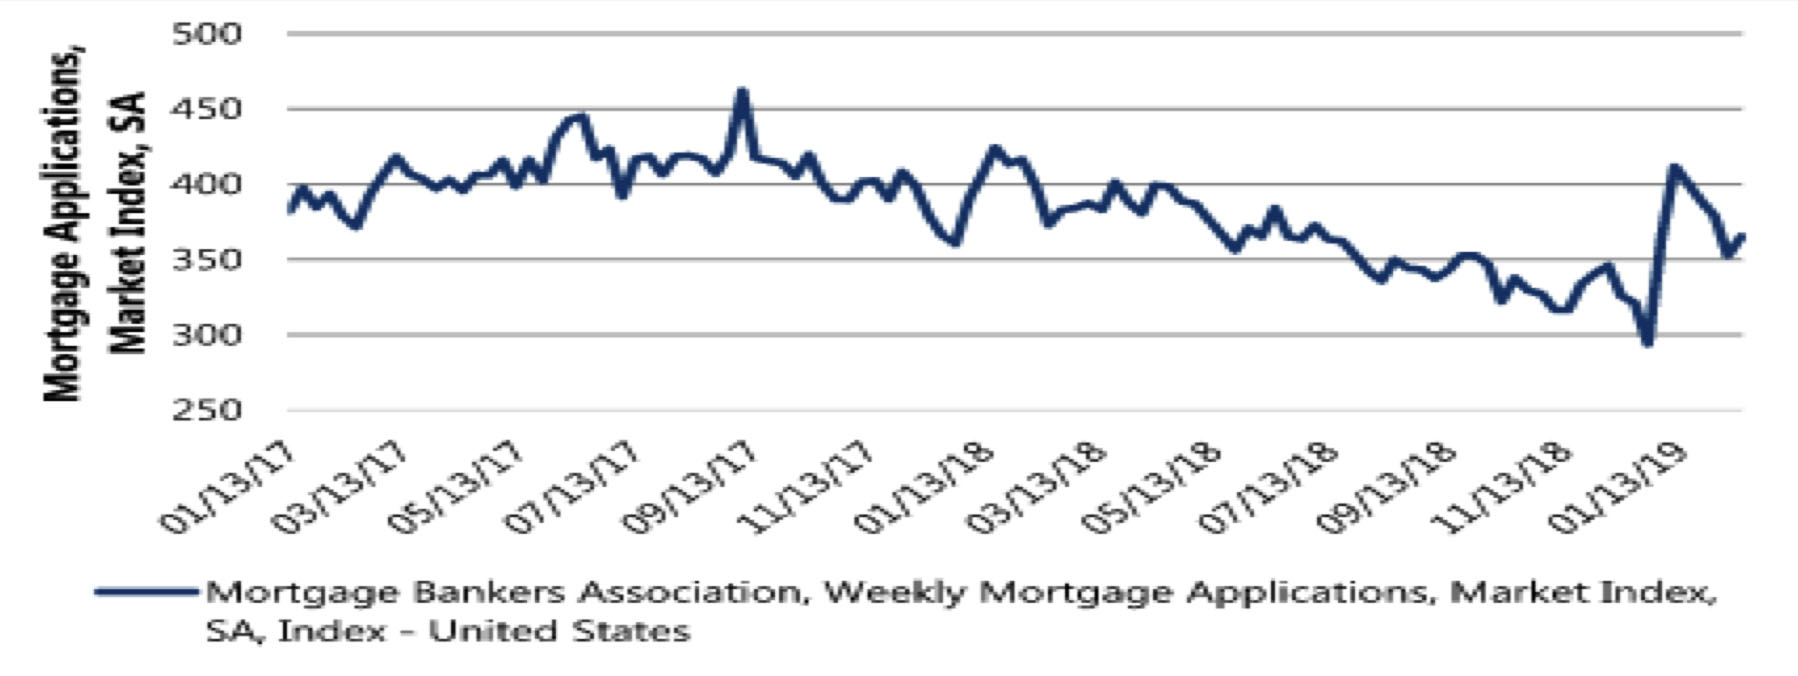
Source: Mortgage Bankers Association, FactSet, Jefferies
While recent data may be a head fake, there is reason to believe in its sustainability. The homeownership rate, according to the Census Bureau, increased to 64.8% (up 60 basis points year over year) in the fourth quarter, driven by a younger buyer. More specifically, home ownership among buyers under 35 years old increased to 36.5%, up 50 basis points compared to last year. This may be surprising to many industry participants after weak existing home sales last fall lead many to buy into the narrative of millennial homeownership postponement. Older millennials were also involved in the cohort that showed the largest increase overall, the 35-44 year old age group at 61.1%, up 220 basis points against the prior year. It is unlikely for these rates to decrease moving forward as more millennials enter the housing formation years of their lives. The increase may also portend a strong spring selling season as interest rates have yet to revert higher in a meaningful way.
Exhibit 3: Quarterly Homeownership Rates and Seasonally Adjusted Homeownership Rates
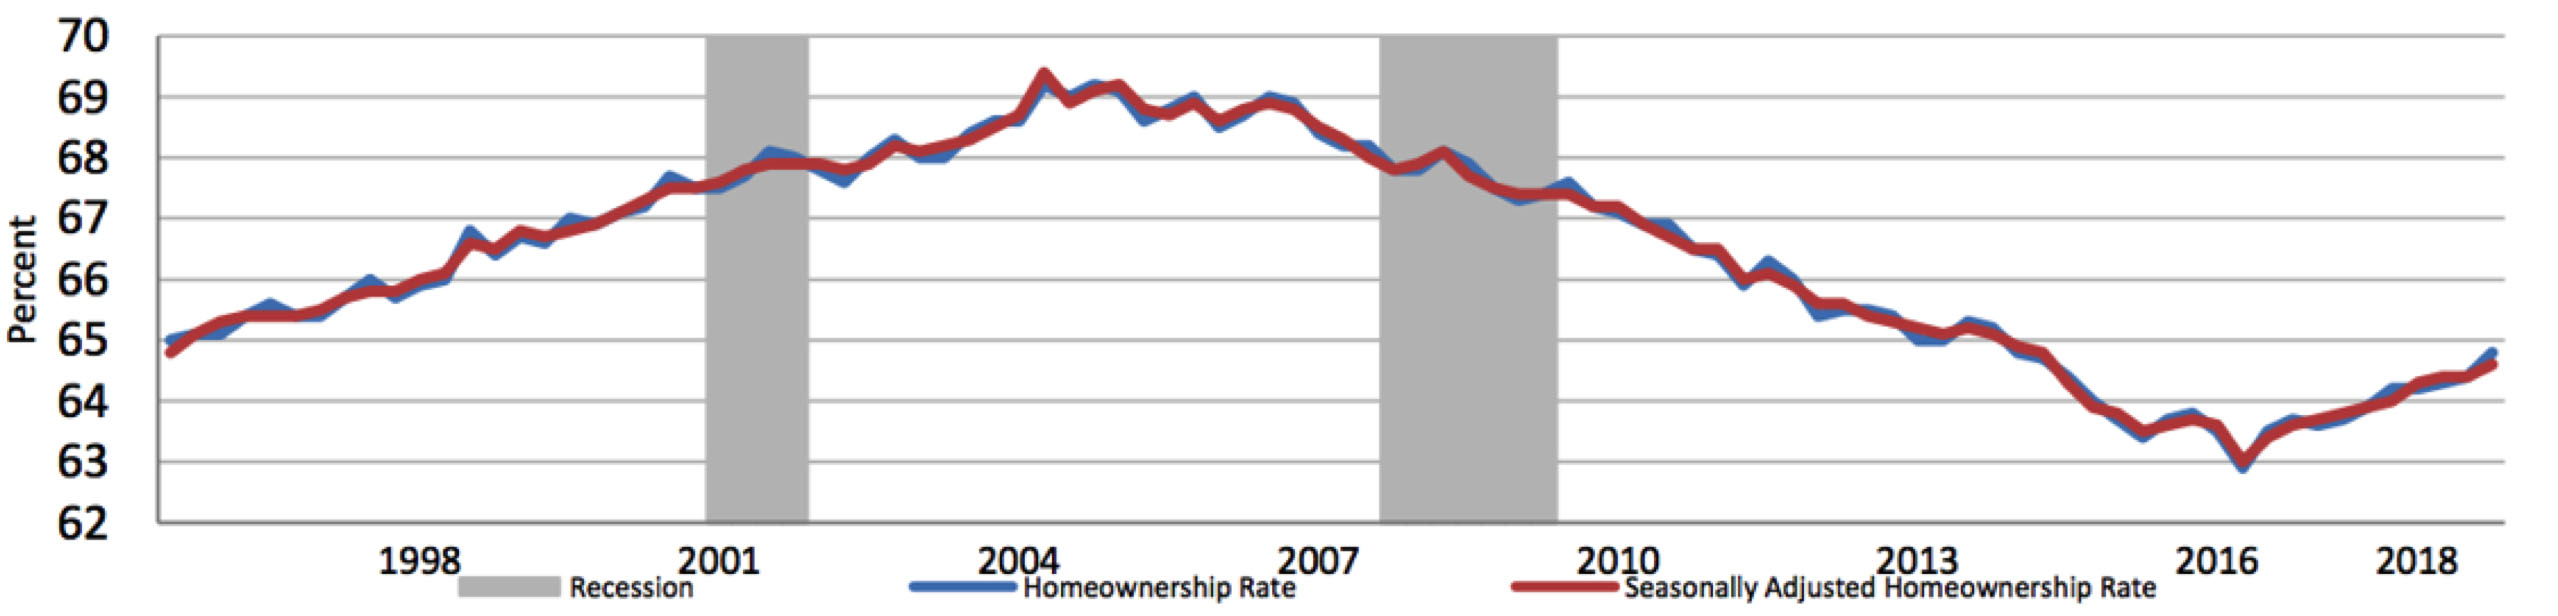
Source: U.S. Census Bureau, Current Population Survey/Housing Vacancy Survey, February 28,2019, Recession data: National Bureau of Economic Research
This information is not intended to provide investment advice. Nothing herein should be construed as a solicitation, recommendation or an offer to buy, sell or hold any securities, market sectors, other investments or to adopt any investment strategy or strategies. You should assess your own investment needs based on your individual financial circumstances and investment objectives. This material is not intended to be relied upon as a forecast or research. The opinions expressed are those of Driehaus Capital Management LLC (“Driehaus”) as of March 2019 and are subject to change at any time due to changes in market or economic conditions. The information has not been updated since March 2019 and may not reflect recent market activity. The information and opinions contained in this material are derived from proprietary and non-proprietary sources deemed by Driehaus to be reliable and are not necessarily all inclusive. Driehaus does not guarantee the accuracy or completeness of this information. There is no guarantee that any forecasts made will come to pass. Reliance upon information in this material is at the sole discretion of the reader.
Other Commentaries
Driehaus Micro Cap Growth Strategy March 2024 Commentary with Attribution
By US Growth Equities Team
Driehaus Small Cap Growth Strategy March 2024 Commentary with Attribution
By Jeffrey James