“Underresearched, underowned, and underappreciated” was how one of our clients aptly described the opportunity set within the small cap segment of emerging markets. Over the past ten years, emerging market small caps have registered 2500 basis points of excess returns relative to the all capitalization MSCI Emerging Markets Index, providing a source of alpha for managers with sufficient flexibility in their mandates to allocate to such companies.
However, since EM equities bottomed in February 2016, small caps have been out of favor relative to their larger cap counterparts. From February 1, 2016 through the end of August 2018, large caps have returned 57%, beating small caps by 2200 basis points, an unprecedented margin over such a timeframe. This month, we examine some reasons for this underperformance, as well as some cause for optimism surrounding the forward outlook for small caps.
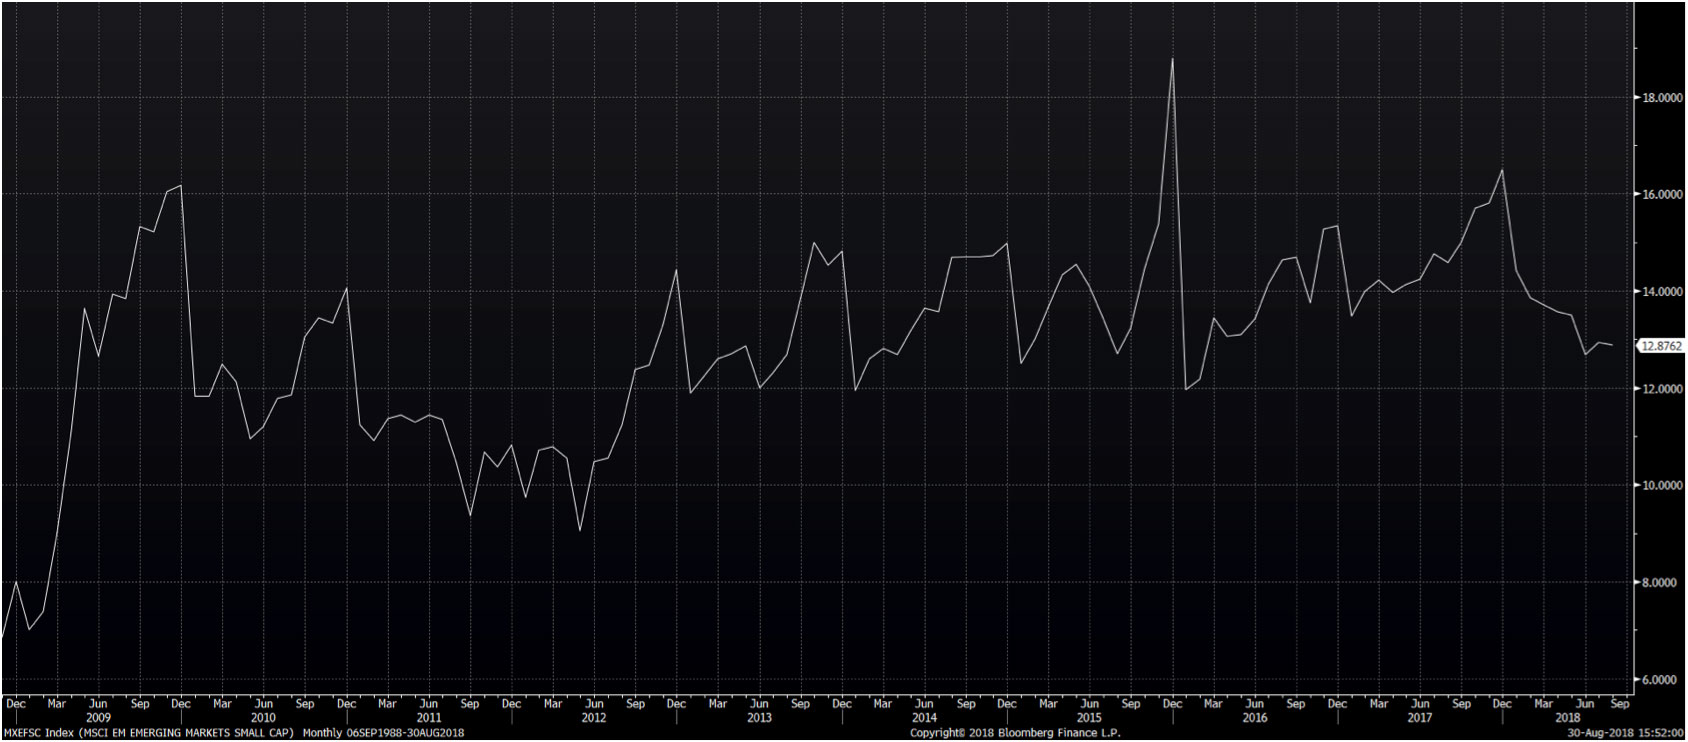
When assessing the recent underperformance of EM small caps, the starting point for relative valuation plays a significant role in the discussion. From 2010-2015, as economic growth slowed across many emerging markets, commodity prices declined, and global trade decelerated, the domestic focus of small caps became increasingly appealing to allocators. This pushed valuations up to record highs near the end of 2015, with the high-teens P/E multiple at the time substantially higher than the 11x multiple for large caps. (Exhibit 1) As a mean reversion rally unfolded in EM in 2016, this valuation gap closed, and today the 12.8x multiple for small caps is similar to that of large caps at 12.0x.
Exhibit 1: MSCI EM Small Cap Index P/E Ratio

Source: Bloomberg
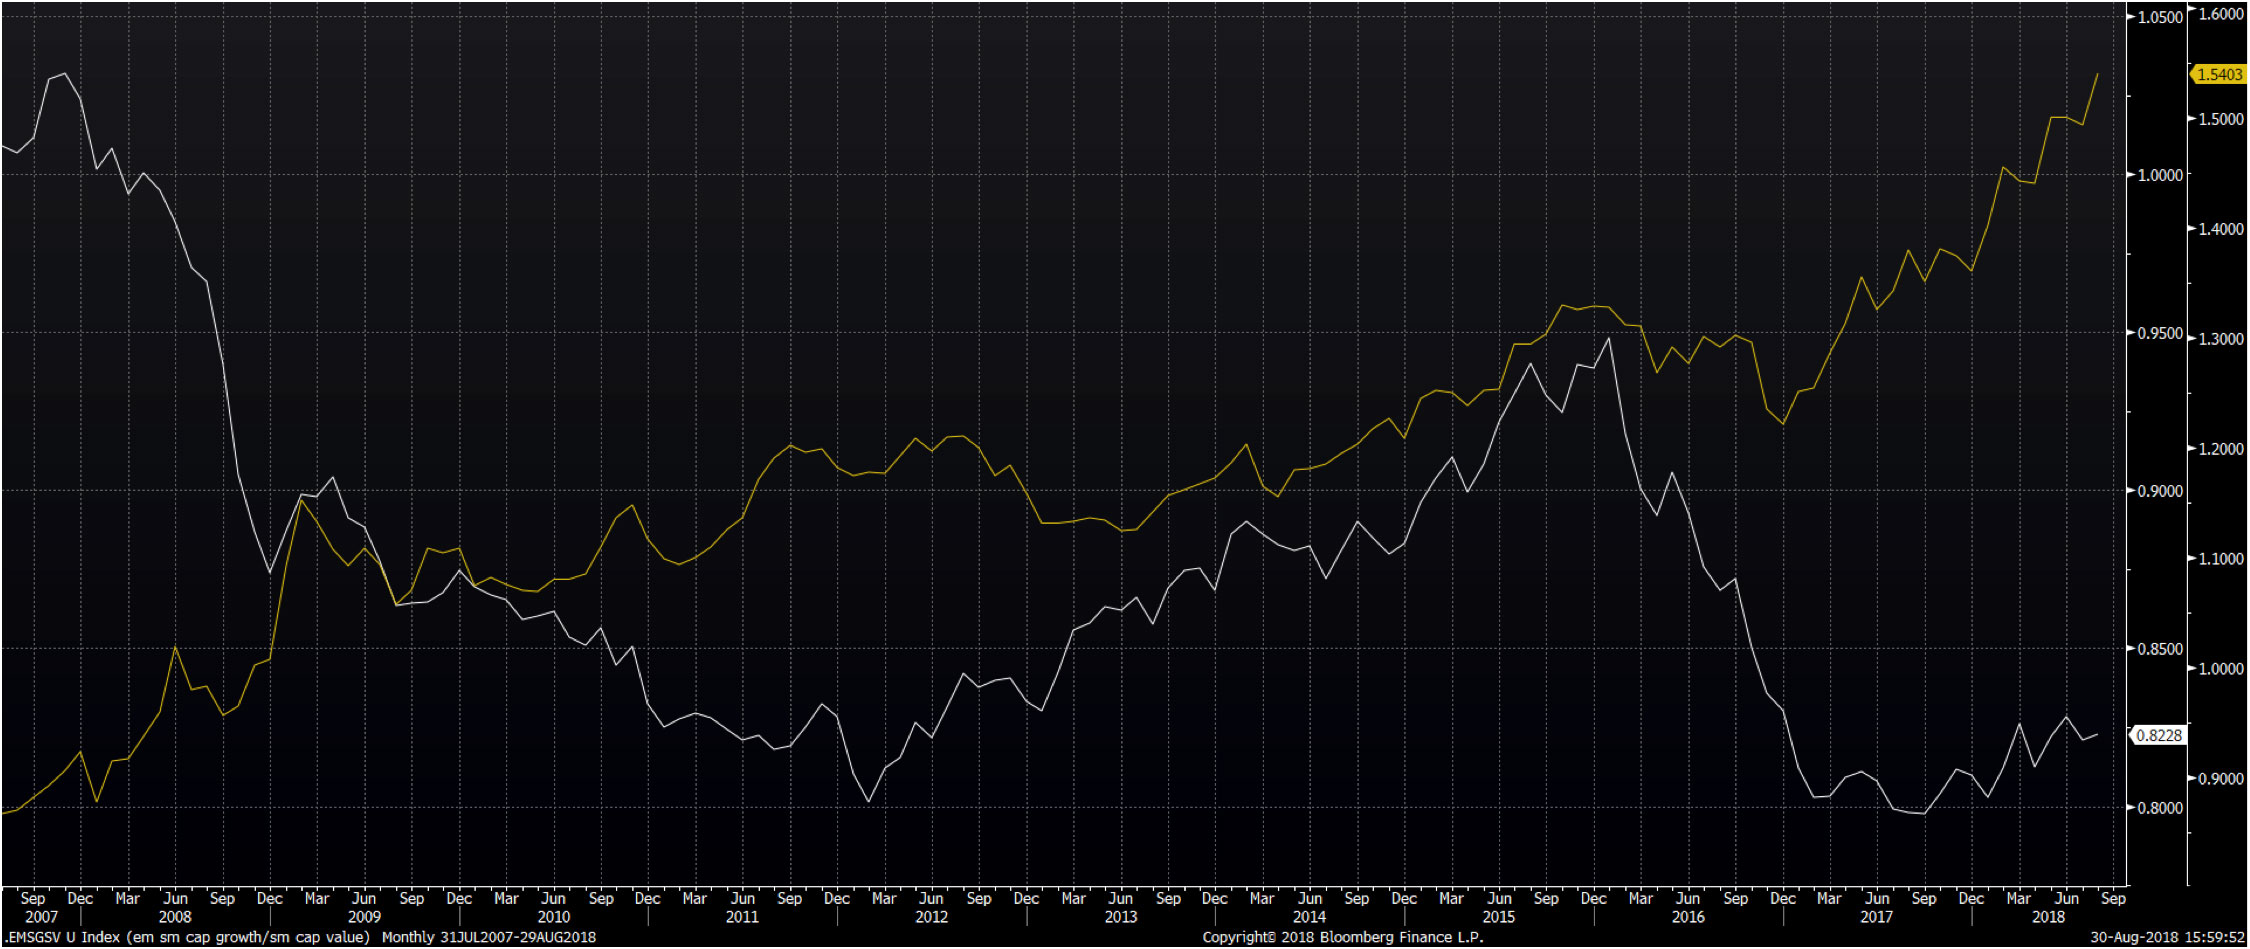
Further, in an anomaly relative to global trends that have been felt most acutely in US and developed markets, growth has significantly underperformed value within the small cap segment of EM. As shown below, we have seen such periods of divergence in the past. The disparity between growth/value trends in EM small cap and the US is even more extreme than it was in early 2012. (Exhibit 2) This may be of particular interest to asset allocators who are in search of growth characteristics but are also cognizant of valuation.
Exhibit 2: Growth vs. Value indices within MSCI EM Small Cap (white line) and S&P 500 (yellow line)

Source: Bloomberg
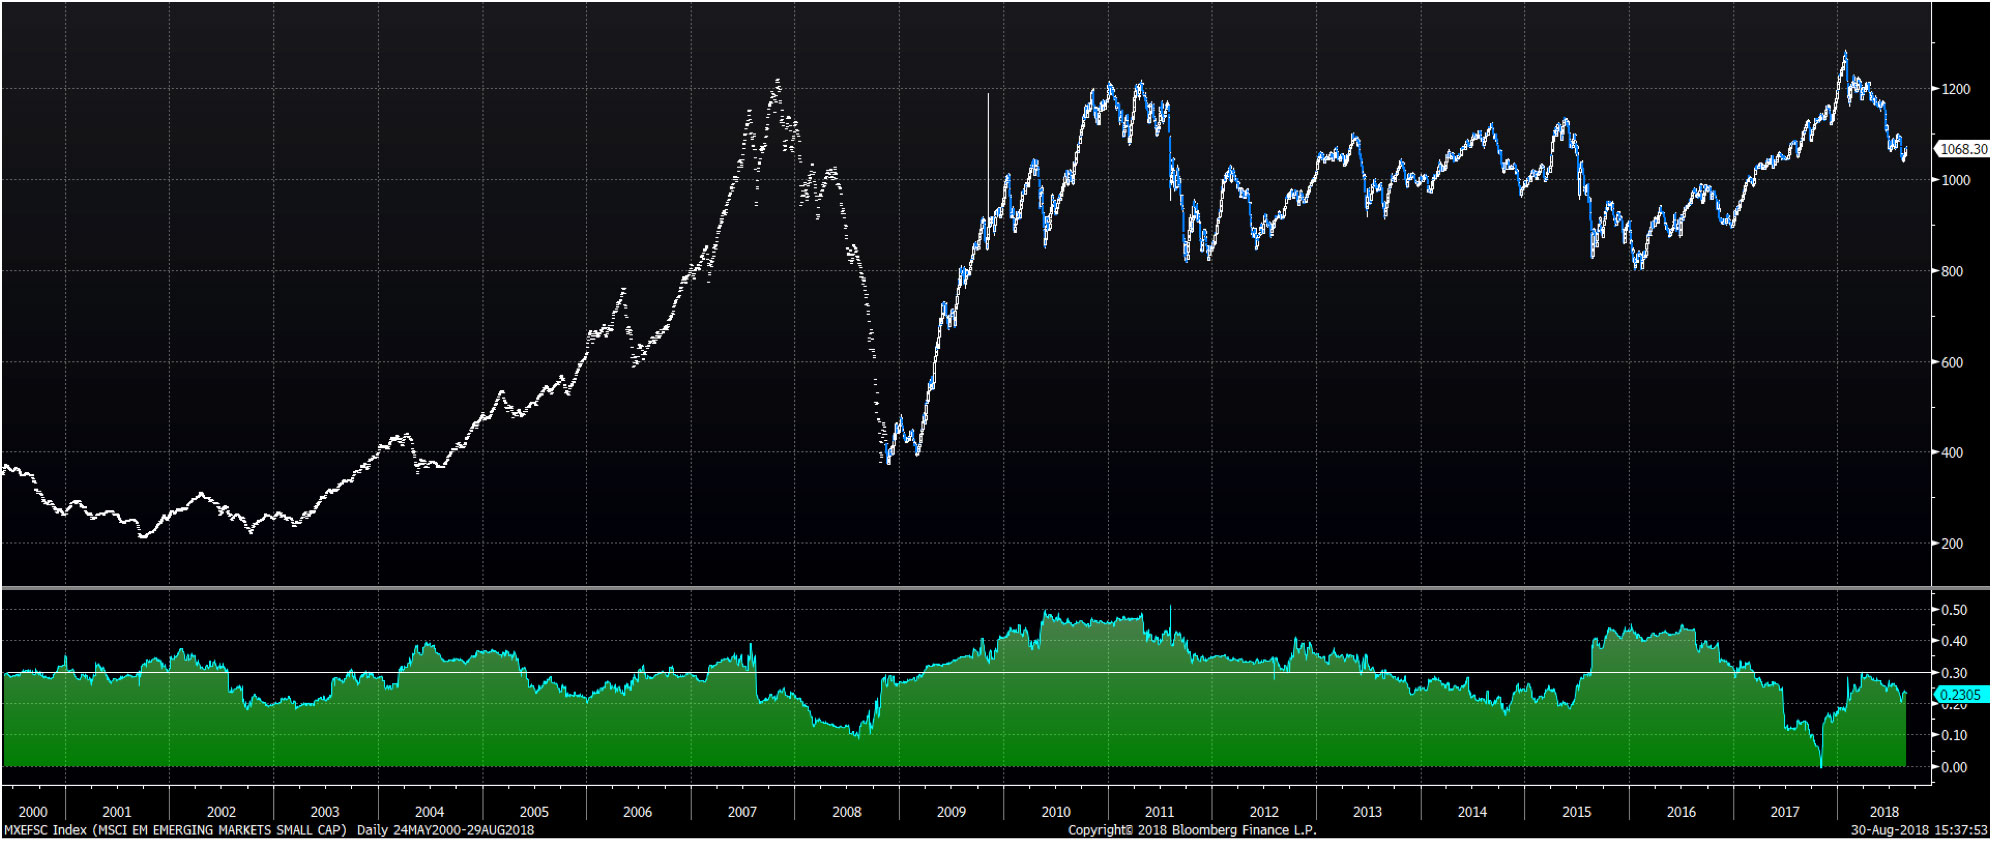
Further, EM small caps are a source of less correlated returns amid a world in which correlations generally remain high. The long-term average correlation between MSCI EM Small Cap and the Russell 2000 index is 0.3, and while US small caps have been making new highs by the day, EM small caps have moved sideways for the last ten years.
However, such conditions may not last in perpetuity, and EM small caps have shown the ability to generate outsized returns in the past, particularly as periods of signficant macro turbulence start to abate. For example, between June 2002-2007, EM small caps outperformed the Russell 2000 by nearly 200 percentage points.
Exhibit 3: 250-day rolling correlation between MSCI EM Small Cap Index and Russell 2000

Source: Bloomberg
The EM small cap opportunity set encompasses a deep universe of over 2,800 companies that are below $6 billion in market cap and trade at least $3.5 million per day. Further, there is scant research coverage of such companies, as an average of seven sell side analysts cover companies that fit this profile, with 500 having no coverage at all, and another 600 being covered by only one to three analysts. This compares favorably to both the mid/large cap space within EM, as well as the Russell 2000.
Exhibit 4: Analyst coverage of EM companies

Source: Bloomberg
Given the robust growth we see in economies such as India, the opening up of capital markets in places like mainland China, and the ongoing maturation of smaller markets such as Vietnam, Indonesia, and parts of Sub-Saharan Africa, we see this robust, inefficient opportunity set only continuing to grow over time. While it has been disappointing 18 months for investors in small caps within emerging markets, the growth, inefficiency, low correlation, and increasingly compelling valuations makes this segment of EM a potential source of alpha in the years ahead.
This information is not intended to provide investment advice. Nothing herein should be construed as a solicitation, recommendation or an offer to buy, sell or hold any securities, market sectors, other investments or to adopt any investment strategy or strategies. You should assess your own investment needs based on your individual financial circumstances and investment objectives. This material is not intended to be relied upon as a forecast or research. The opinions expressed are those of Driehaus Capital Management LLC (“Driehaus”) as of September 2018 and are subject to change at any time due to changes in market or economic conditions. The information has not been updated since September 2018 and may not reflect recent market activity. The information and opinions contained in this material are derived from proprietary and non-proprietary sources deemed by Driehaus to be reliable and are not necessarily all inclusive. Driehaus does not guarantee the accuracy or completeness of this information. There is no guarantee that any forecasts made will come to pass. Reliance upon information in this material is at the sole discretion of the reader.
Other Commentaries
Driehaus Emerging Markets Small Cap Equity Strategy March 2024 Commentary With Attribution
By Chad Cleaver, CFA
Driehaus Emerging Markets Growth Strategy March 2024 Commentary with Attribution
By Howie Schwab