In late 2014, Saudi Arabia, the largest oil producing country in the Organization of Petroleum Exporting Countries (OPEC), shifted its strategy from one of supporting the price of oil to one of protecting market share. Over the next year, as Saudi Arabian production steadily rose and global oil demand slowed, the price of oil fell over 70%—one of the most significant declines of the last 20 years. As a result, energy stocks, as measured by the Energy Select Sector SPDR Fund (ticker: XLE), significantly underperformed the SPDR S&P 500 ETF (ticker: SPY).
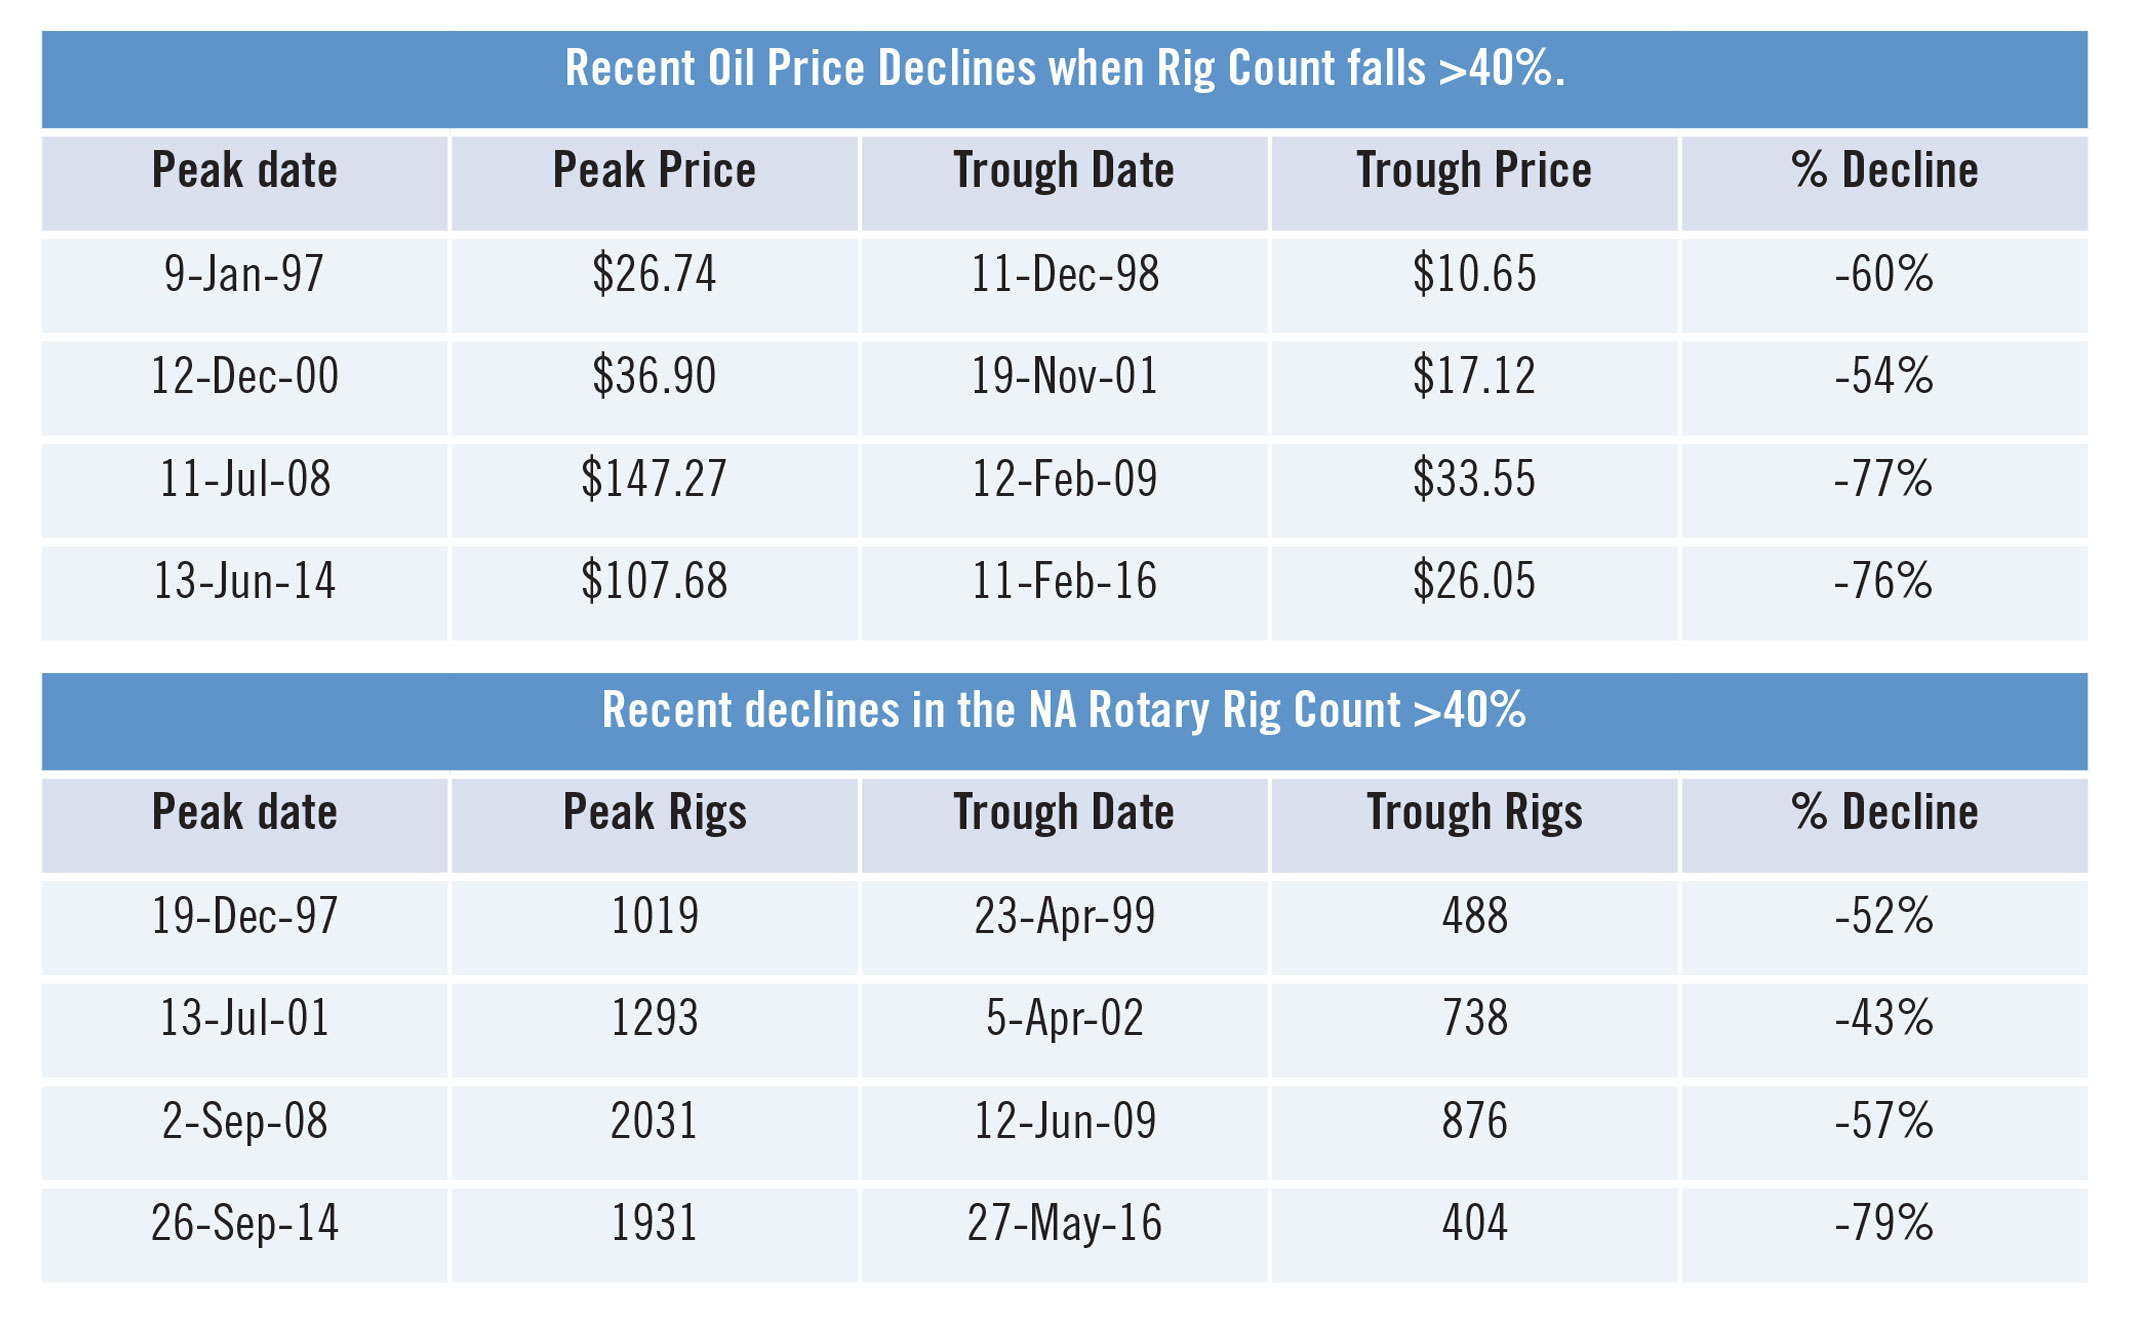
As the price of oil dropped, activity as measured by the number of US onshore rotary rigs fell by more than 70%. The last few times the US rig count has seen a decline of over 40%, the bottom in the rig count typically occurred about 120 to 137 days after the price of oil bottoms (Exhibit 1), and this situation seems to be playing out in the current cycle. After declining about 76% since late 2014, oil bottomed at $26.05 on February 11, 2016 and the US rotary rig count appears to have bottomed 106 days later on May 27, 2016 at 404 rigs (Exhibit 2).
Exhibit 1: The bottom in US rotary rig count usually precedes the bottom in the price of oil
Source: Baker Hughes
Exhibit 2: Baker Hughes US Land Rig Count (2007-2016)
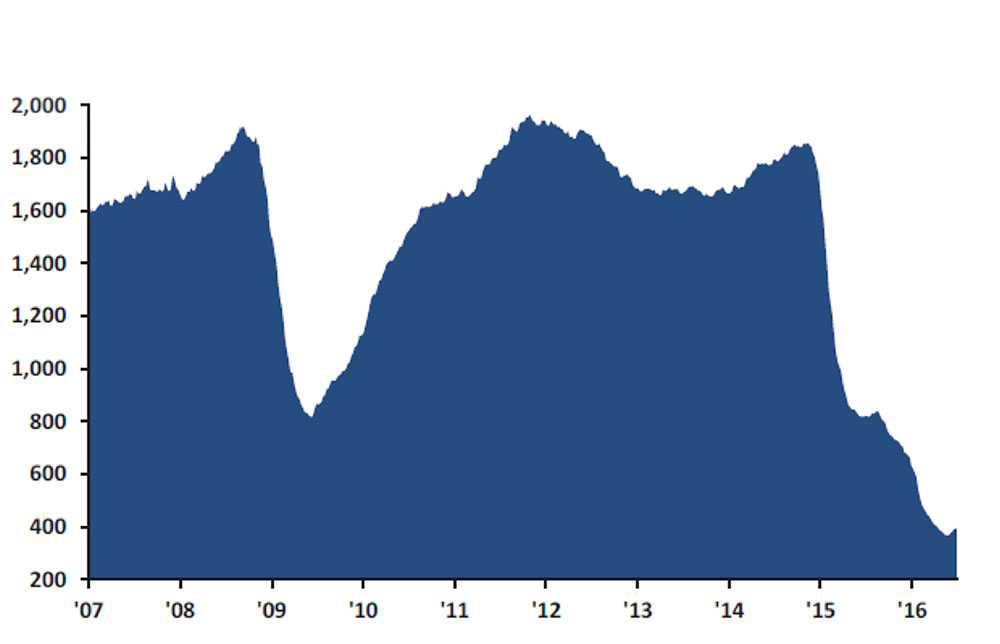
Source: Baker Hughes, Evercore ISI Research
Intuitively, it would seem that once the US rig count bottoms energy stocks would be in for a period of sustained outperformance. However, recent history has shown that energy stocks were more likely to underperform or trade in-line with the SPDR S&P 500 ETF Trust (SPY) in the year following a bottom in the rig count (Exhibit 3).
Exhibit 3: Energy stock performance following bottom in rig counts versus broad equity market
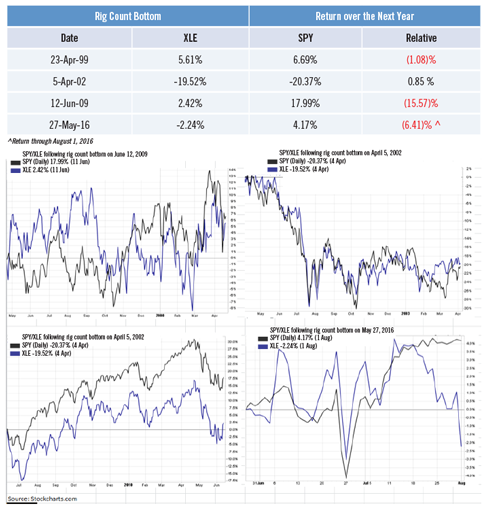
Source: Stockcharts.com
The energy sector (XLE) peaked on a relative basis versus the S&P 500 (SPY) in early 2011 and underperformed by about 53% until bottoming in early 2016. This decline compares in magnitude to the roughly 70% underperformance seen by the KBW Bank Index ($BKX) from 2006 to 2009 and the 66% underperformance seen by the Technology Select SPDR Fund (XLK) from 2000 to 2002. Both the $BKX and the XLK saw significant outperformance off the initial bottom, but what is interesting is that after about three to fifteen months, they topped out on a relative basis and then only traded in-line or underperformed the SPY over the next two years. Exhibit 4 shows where $BKX/XLK outperformance was 135 days after bottoming (the point where XLE currently is) and how each sector performed over the following timeframe up until three years after the initial bottom.
Exhibit 4: Bank ($BKX) and tech sector (XLK) performance following performance bottoms
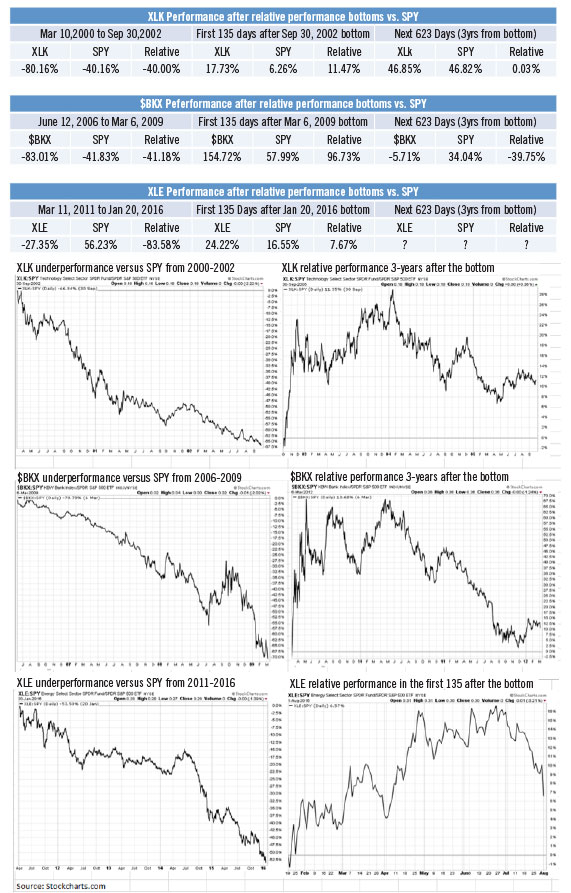
Source: Stockcharts.com
While the May bottom in the US rig count does create some reason for optimism, recent history has shown that stocks in the energy sector could struggle to outperform the overall market over the next few years. While some energy stocks will likely outperform in the coming years, broad energy sector outperformance looks unlikely based on the above historical comparisons.
This information is not intended to provide investment advice. Nothing herein should be construed as a solicitation, recommendation or an offer to buy, sell or hold any securities, market sectors, other investments or to adopt any investment strategy or strategies. You should assess your own investment needs based on your individual financial circumstances and investment objectives. This material is not intended to be relied upon as a forecast or research. The opinions expressed are those of Driehaus Capital Management LLC (“Driehaus”) as of August 2016 and are subject to change at any time due to changes in market or economic conditions. The information has not been updated since August 2016 and may not reflect recent market activity. The information and opinions contained in this material are derived from proprietary and non-proprietary sources deemed by Driehaus to be reliable and are not necessarily all inclusive. Driehaus does not guarantee the accuracy or completeness of this information. There is no guarantee that any forecasts made will come to pass. Reliance upon information in this material is at the sole discretion of the reader.
Other Commentaries
Data Center
By Ben Olien, CFA
Driehaus Micro Cap Growth Strategy March 2024 Commentary with Attribution
By US Growth Equities Team