Since Donald Trump was elected President on November 8th 2016, bank stocks have attracted an increasing amount of attention from investors. Expectations built quickly for banks to reap the benefits of a more relaxed regulatory environment, higher interest rates, lower taxes and faster economic growth. In particular, bank investors started to bake in more inflationary fiscal policy and faster economic growth that would push the Federal Reserve to raise rates more aggressively. As measured by the NASDAQ Bank Index, bank stocks rose an astounding 26% from the day of the election through the end of the year. This move was right in line with a 32% increase in the yield on the 10-year Treasury note and a 24% increase in the difference between the 10-year and 2-year Treasury notes (a standard measure of the slope of the yield curve).
Given how easily rates are monitored, their direction, along with the slope of the yield curve, have proven to be the most tangible parts of the “Trump Bump” that bank stocks received after the election. Intuitively, higher rates and a steeper yield curve should result in wider net interest margins (NIM) for banks, especially those that have a high mix of low-cost deposits, such as consumer checking accounts, and variable rate loans that are tied to short term rates like Fed Funds or LIBOR (most commercial loans fit this description). The expectation among most bank investors is that rate hikes will have a positive impact on NIMs.
However, a look at the last 20 years of net interest margins shows that there is very little correlation between Fed Funds and NIMs.
Exhibit 1: Average Bank NIM vs Fed Funds Rate
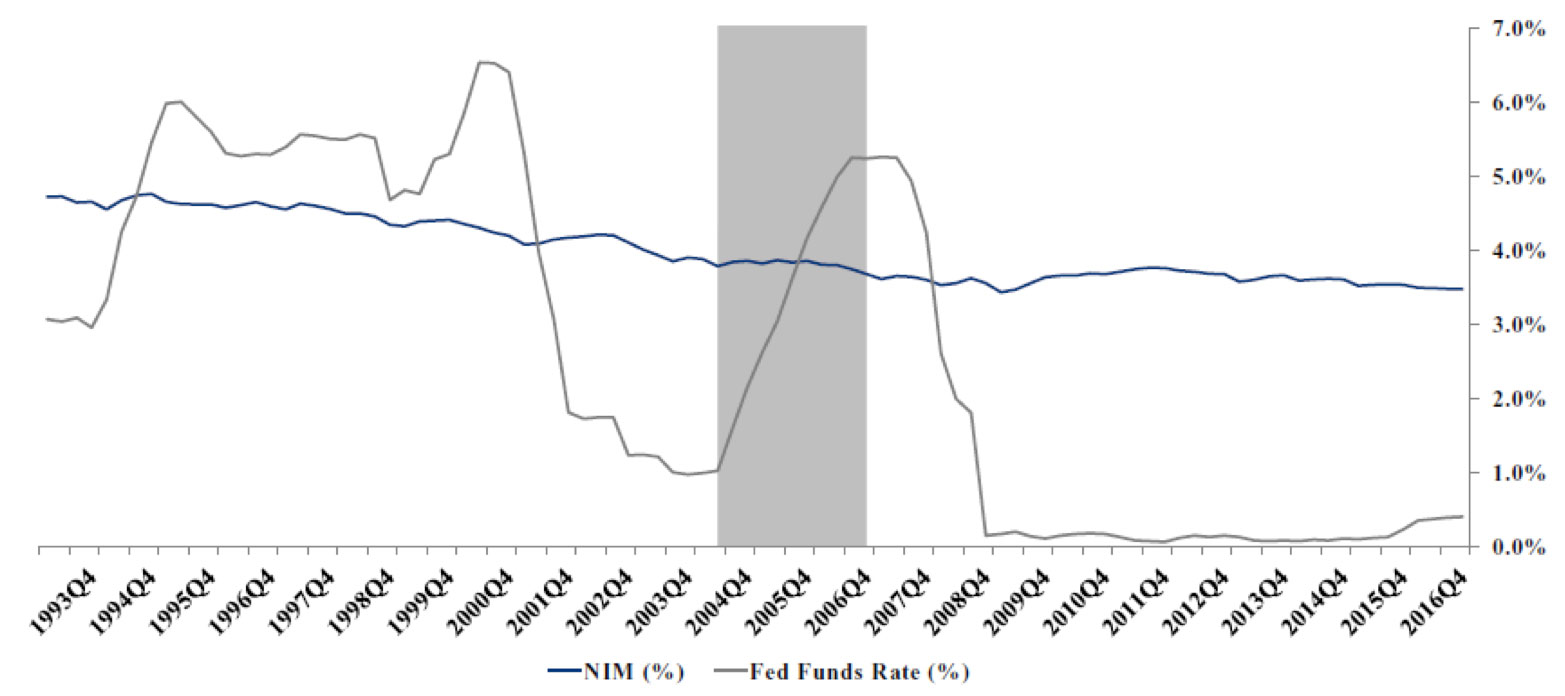
Note: Highlighting represents last Fed rate cycle Source: Bloomberg, SNL, and KBW Research
While each rate hike cycle has different factors at work, at best, the last two cycles yielded only a very modest and temporary boost to NIMs. And historically, Fed Funds rate hikes have actually caused the yield curve to flatten and invert, creating a suboptimal environment for banking.
Exhibit 2: Yield Curve vs. Fed Funds Rate
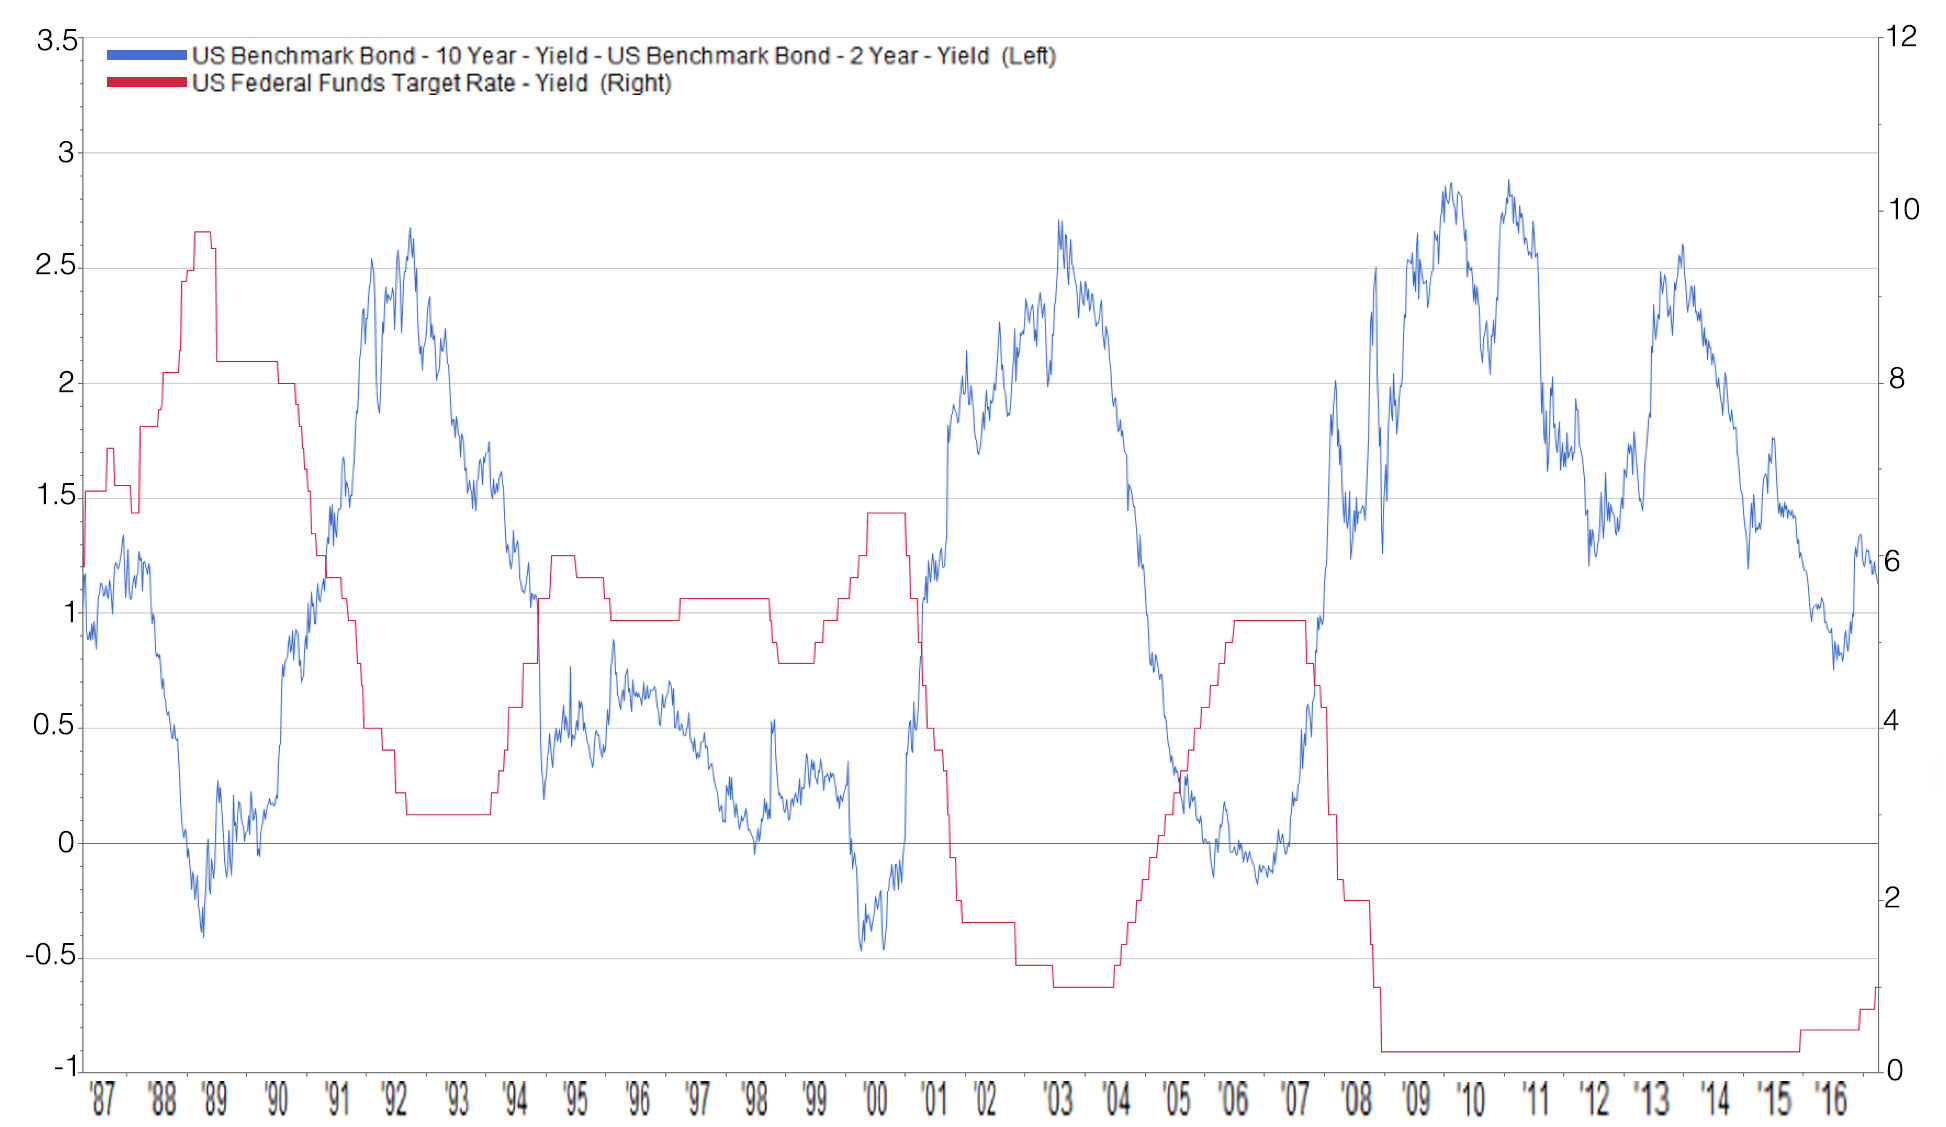
Source: FactSet
But could this time be different? Could the current rate hike cycle result in a stable yield curve and higher NIMs? It’s possible, because what makes this cycle unique is that coming off the historically low level of Fed Funds, deposit betas (the rate at which deposit costs rise with Fed Funds) may be much lower than in the past. An ample level of liquidity industry-wide and a large amount of consolidation both lead to less price competition than in previous cycles and could keep deposit betas in check. Thus far, these and other factors appear to be keeping deposit betas very low even though we are nearly a year and a half, and 75 basis points into a rate hike cycle. Management teams we talk to have not seen much movement in deposit rates yet, and Bankrate has reported that one year CD rates are still in the same range as before the first rate hike occurred. Should these conditions hold, bank margins and earnings are likely to move higher.
Exhibit 3: One Year CD Rate (25 day moving average) vs Fed Funds Rate
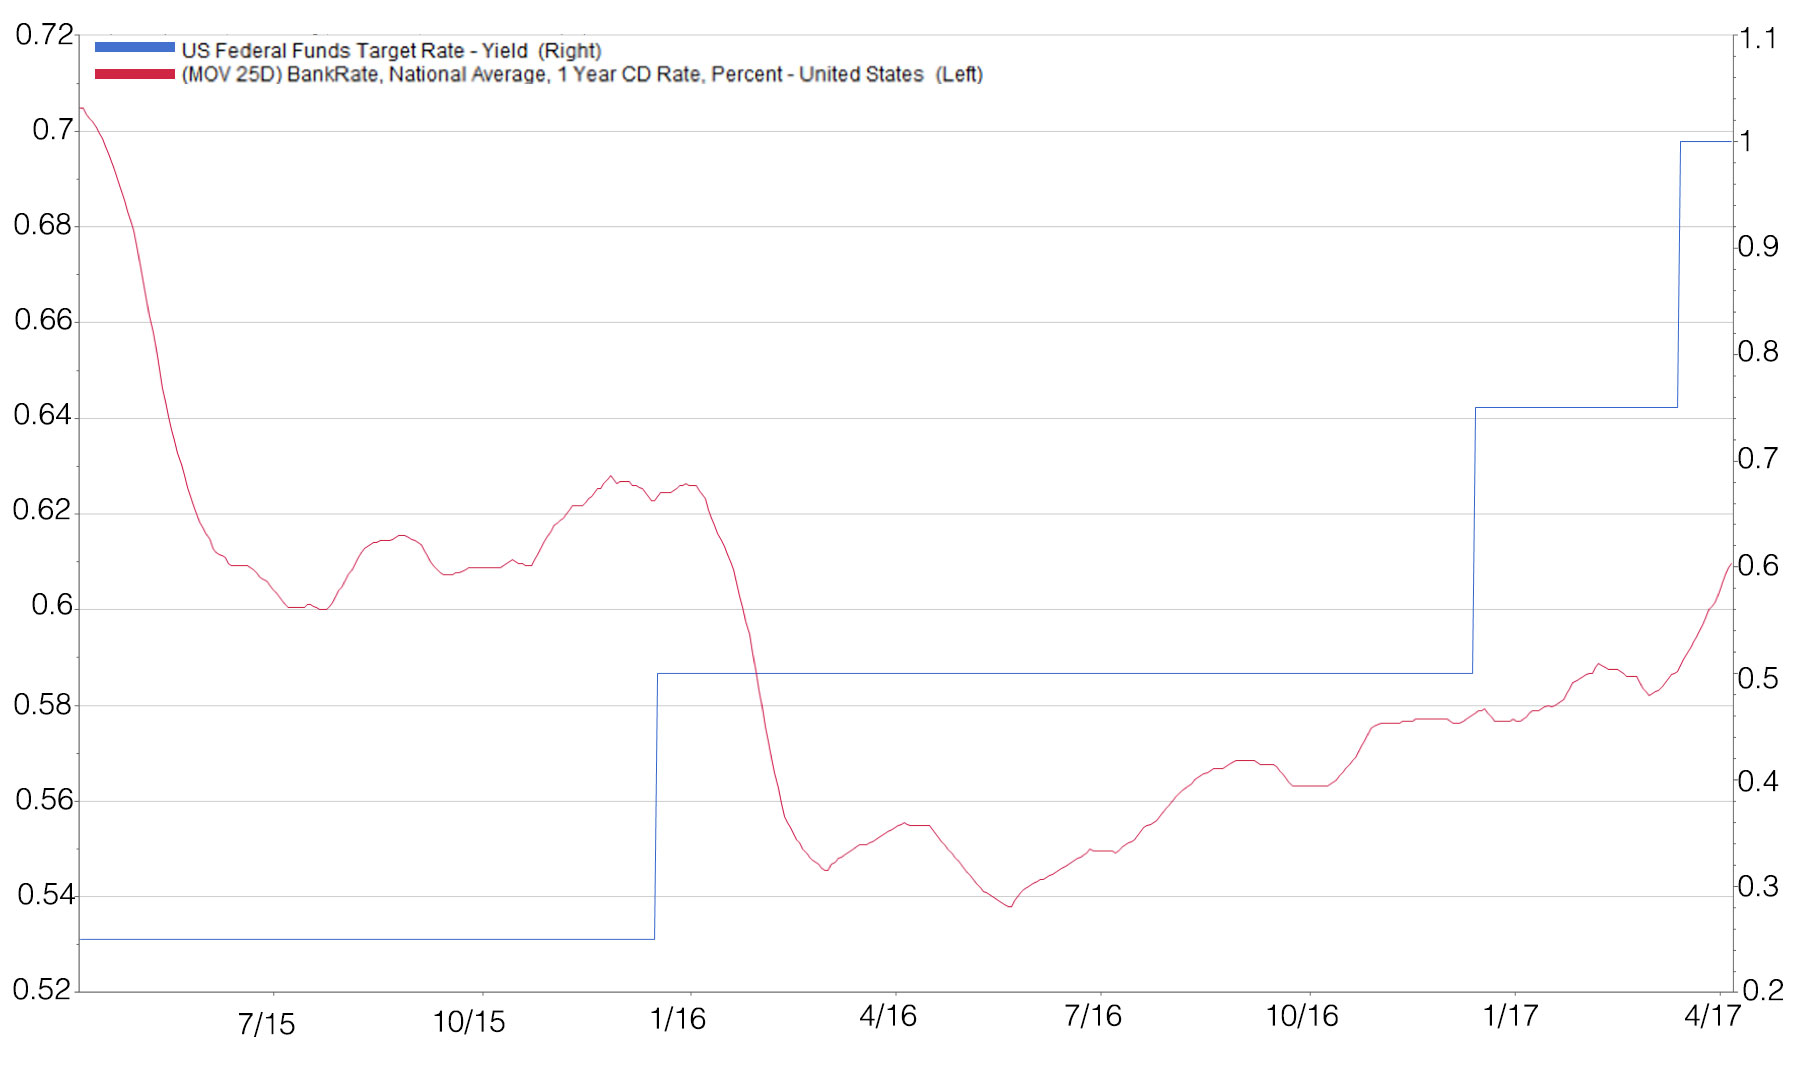
Source: FactSet
This information is not intended to provide investment advice. Nothing herein should be construed as a solicitation, recommendation or an offer to buy, sell or hold any securities, market sectors, other investments or to adopt any investment strategy or strategies. You should assess your own investment needs based on your individual financial circumstances and investment objectives. This material is not intended to be relied upon as a forecast or research. The opinions expressed are those of Driehaus Capital Management LLC (“Driehaus”) as of April 2017 and are subject to change at any time due to changes in market or economic conditions. The information has not been updated since April 2017 and may not reflect recent market activity. The information and opinions contained in this material are derived from proprietary and non-proprietary sources deemed by Driehaus to be reliable and are not necessarily all inclusive. Driehaus does not guarantee the accuracy or completeness of this information. There is no guarantee that any forecasts made will come to pass. Reliance upon information in this material is at the sole discretion of the reader.
Other Commentaries
Data Center
By Ben Olien, CFA
Driehaus Micro Cap Growth Strategy March 2024 Commentary with Attribution
By US Growth Equities Team