The Jumpstart Our Business Startups Act (JOBS Act) was signed into law on April 5, 2012, and with it came plenty of disagreement regarding its likely benefit to the economy and investors. The goal of the JOBS Act was to improve access to the public markets for young companies, enabling them to invest more in their businesses, create jobs and stimulate the economy, but many worried about potentially negative ramifications for investors.
Much of the controversy surrounded the streamlining of the initial public offering (IPO) process that allowed for reduced levels of disclosure and fewer years of historical audited financials for businesses designated as emerging growth companies (EGCs). Since then, many market participants and pundits opined that less disclosure would harm investors, encourage fraud and impair investor confidence in our capital markets.
While it would be quite difficult at this time to assess how the JOBS Act has affected the economy, there is enough data for us to consider a question pertinent to active small cap investors: Have JOBS Act IPOs been good investments? Within the financial media there have been several anecdotes about poorly performing new companies not being “ready” or as having “no business being a public company.” These stories often include disparaging allusions toward the JOBS Act. What we have not observed are conclusions rooted in actual numbers, which prompted us take a comprehensive look at the data.
We started by examining 528 IPOs that took place after the JOBS Act was signed and then assessed performance through June 24, 2015. (A detailed summary of screening criteria is provided at the end of this document.) The Russell 3000 Index was selected as the benchmark and we used the close of the first day of trading as the purchase price for the IPO, since most investors are not able to establish full positions at the deal price. The results showed that the median IPO underperformed the Russell 3000 Index by 5.6 percentage points. From this simple analysis one could conclude that JOBS Act IPOs have generally been poor performers and that the law has done a disservice to investors, but this does not tell the whole story.
Another way to assess the performance of JOBS Act IPOs is to compare IPOs that did not qualify as EGCs and thus did not benefit from the law with those that did. While there is no exact way to screen for EGCs, to keep it simple we applied the most commonly used definition of EGCs, which requires gross revenue for the prior fiscal year to be under $1 billion. Here we found a wide difference in performance as the median EGC underperformed by 9.1 percentage points while non-EGCs actually outperformed by 16.5 percentage points, a substantial 25.6 percentage points difference (Exhibit 1). So now can we conclude that the JOBS Act is responsible for bringing a bunch of garbage stocks public? Not so fast…
Exhibit 1: Median IPO Over- And Underperformance Post-JOBS Act vs Russell 3000 Index
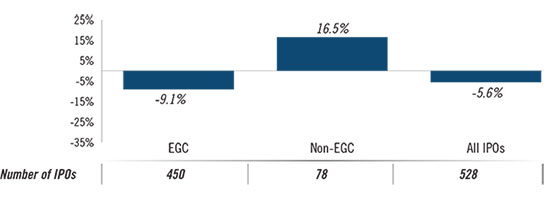
Source: Factset, Driehaus Capital Management Performance data as of June 24, 2015 Time period for IPOs is from 6/1/12 through 3/31/15
Next we examined the performance of 268 IPOs for the comparable period prior to the JOBS Act era—August 1, 2009 through June 1, 2012—to see if the companies that could have been defined as EGCs during that period underperformed non-EGCs by a similarly wide margin (Exhibit 2). The results were interesting: EGCs underperformed by 15.3 percentage points while non-EGCs outperformed by 4.0 percentage points, or a difference of 19.3 percentage points. So while the non-EGC versus EGC spread widened after the JOBS Act took effect, it was not because EGCs going public after the JOBS Act performed more poorly—they actually have been doing better. But non-EGC IPO performance has markedly improved after the JOBS Act was signed, accounting for the larger spread. Needless to say, with both non-EGC and EGC IPOs performing more strongly after the JOBS Act, the median underperformance for all IPOs improved from -11.9 percentage points to -5.6 percentage points.
Using relative price performance as the measure of IPO quality, we can conclude that the JOBS Act has not resulted in a deterioration in the quality of smaller cap companies that have gone public. Contrary to what many speculated at the time of its passage (and continue to speculate to this day), the JOBS Act did not prompt a flood of lower-quality companies to go public as this should have resulted in weaker post-deal stock performance for EGCs.
Of course, there will always be stories of newly public companies that failed to meet expectations and saw their stock prices punished, but this does not appear to be happening with any greater frequency after the enactment of the JOBS Act. Anyone that remembers Refco, a company that went bankrupt 62 days after its IPO in August 2005, knows that regardless of the regulatory environment newly public companies can be deeply disappointing, just as they can be wildly successful.
Based on the data and our own experience, it is clear that indiscriminately buying small cap IPOs on the first day of trading does not work as an alpha-generating strategy. That is why having a thorough research process that can discern which investments are worthy is critical. Nowhere is this more important than for smaller cap IPOs, where the relative lack of information and operating history can cause investors to vastly overestimate or underestimate a company’s future earnings potential. This yields significant alpha opportunities for active small cap managers—look no further than the 125 IPOs since June 1, 2012 that have outperformed by more than 50 percentage points, as well as the 107 that underperformed by a similar margin.
Exhibit 2: Median IPO over- and underperformance Pre- & Post-JOBS Act vs Russell 3000 Index
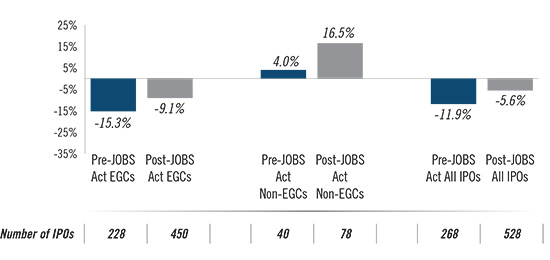
Source: Factset, Driehaus Capital Management Performance data as of June 24, 2015 Time period for IPOs is pre-JOBS act: 8/1/09 through 6/1/12; post-JOBS act: 6/1/12 through 3/31/15
A few interesting facts about JOBS Act-era IPOs
- When performance is measured from the IPO price rather than the close on the first day of trading, median outperformance was 10.3 percentage points
- The median increase on the first day of trading was 7.6 percentage points, implying that much of the alpha generated for an IPO when measured from the deal price comes on the first day
- Of the top 10 relative performers, eight were in the health care sector and two were in technology while the bottom 10 were from five different sectors
- The median IPO in the consumer staples, consumer discretionary and health care sectors outperformed while those in the industrial, technology, financials, materials and energy sectors underperformed (Exhibit 3)
- For an IPO that closed flat or down on the first day, the subsequent median underperformance was 19.0 percentage points while those that closed up outperformed by a median of 3.3 percentage points
- IPOs that closed up over 50% on the first day of trading subsequently underperformed by a median of 28.7 percentage points
- While buying EGC IPOs at the close of trading resulted in meaningful underperformance compared to the broader market, the median performance was still positive at 6.8 percentage points
- The smallest deals in terms of amount raised fared the worst as IPOs sized $20-49.9 million underperformed by a median of 3.3 percentage points
Exhibit 3: Median IPO Over- and Underperformance vs the Russell 3000 Index
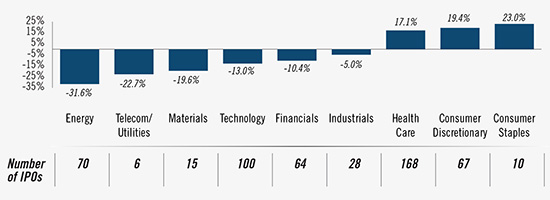
Source: Factset, Driehaus Capital Management Performance data as of June 24, 2015 Time period for IPOs is from 6/1/12 through 3/31/15
Notes
***Screening criteria
- All data was sourced from FactSet
- Time period for IPOs after JOBS Act defined as having taken place 6/1/12-3/31/15. We assumed any IPOs that took place immediately after the law was signed would have taken place anyway and were not influenced. Cutoff of 3/31/15 was chosen because we wanted to have several weeks for aftermarket price performance to be assessed
- The universe included ADRs with primary listings in US
- Current market cap needed to be >$5m
- Excluded Over the Counter Bulletin Board and pink sheets
- The IPO price needed to be >$3
- SPACs (Special Purpose Acquisition Company) that have not consummated acquisitions as of 3/31/15 were excluded
- IPO size needed to be >$20m
- Spinoffs or other new issues that have no IPO data in Factset were excluded
- Stocks that are no longer listed due to acquisition, delisting or other reasons were not included. We assumed that upside events like acquisitions that would have boosted measured returns would have generally been offset by negative events like bankruptcy/delisting
- Returns don’t include dividends – for this reason companies whose returns are primarily driven by dividends such as REITs and utilities were excluded
This information is not intended to provide investment advice. Nothing herein should be construed as a solicitation, recommendation or an offer to buy, sell or hold any securities, market sectors, other investments or to adopt any investment strategy or strategies. You should assess your own investment needs based on your individual financial circumstances and investment objectives. This material is not intended to be relied upon as a forecast or research. The opinions expressed are those of Driehaus Capital Management LLC (“Driehaus”) as of June 2015 and are subject to change at any time due to changes in market or economic conditions. The information has not been updated since June 2015 and may not reflect recent market activity. The information and opinions contained in this material are derived from proprietary and non-proprietary sources deemed by Driehaus to be reliable and are not necessarily all inclusive. Driehaus does not guarantee the accuracy or completeness of this information. There is no guarantee that any forecasts made will come to pass. Reliance upon information in this material is at the sole discretion of the reader.
*The Russell 3000 Index measures the performance of the largest 3,000 US companies representing approximately 98% of the investable US equity market. The index is constructed to provide a comprehensive, unbiased and stable barometer of the broad market and is completely reconstituted annually to ensure new and growing equities are reflected.
Other Commentaries
Data Center
By Ben Olien, CFA
Driehaus Micro Cap Growth Strategy March 2024 Commentary with Attribution
By US Growth Equities Team