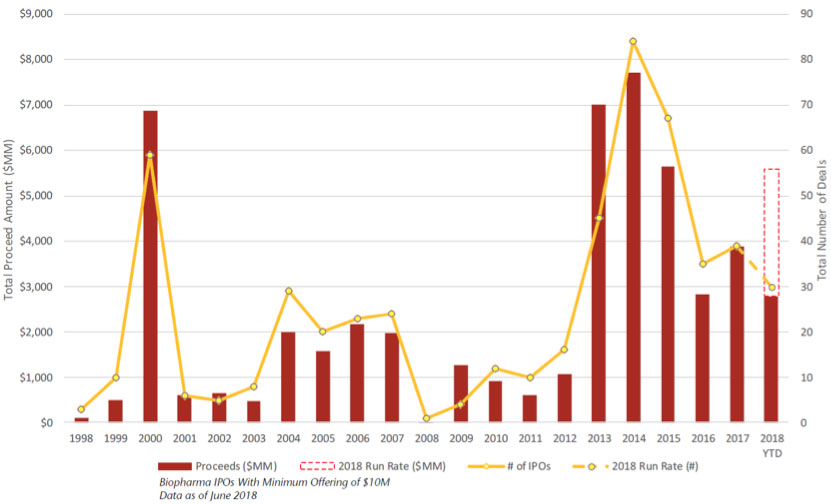
The pace of biopharma IPOs year-to-date is impressive. The chart below shows the data through late-June, and with the round of IPOs that just launched in early-July we are on pace to exceed 2015’s IPO issuance. (Exhibit 1) This would make 2018 the fourth biggest year for new biopharma issuance in the last 20 years.
Exhibit 1: Biopharma IPOs

Source: Jefferies
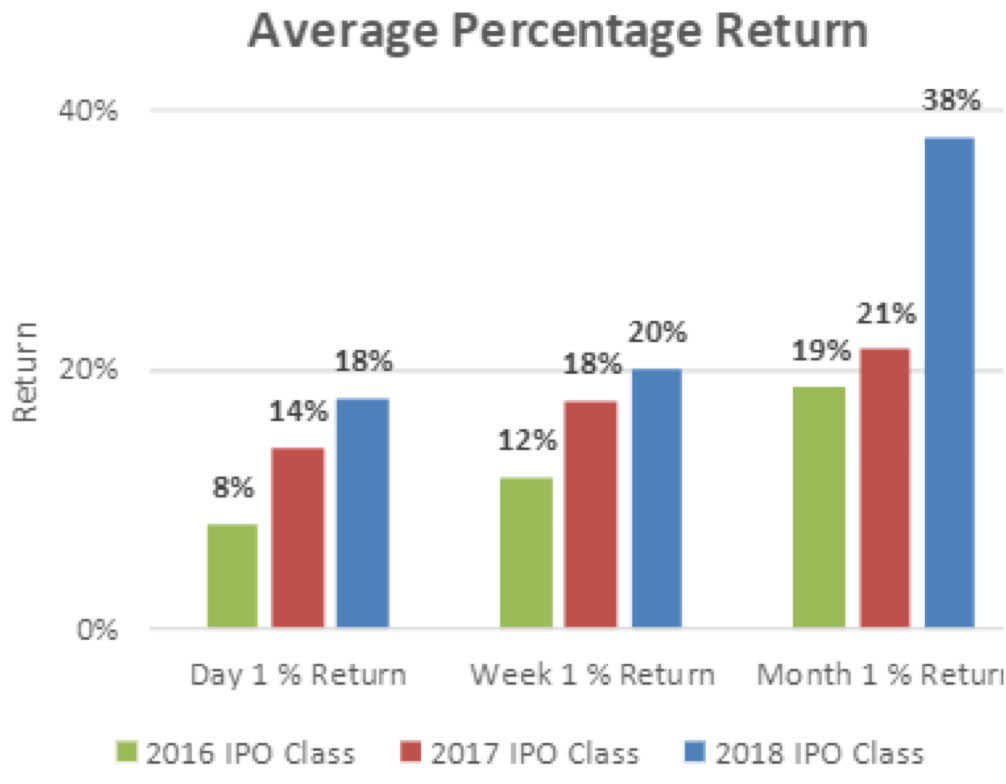
The average percent return, depicted below (Exhibit 2), for biopharma IPOs have been quite high. That is certainly helpful for the pace of new issuance.
Exhibit 2: Average Percentage Return of Biopharma IPOs

Source: Jefferies
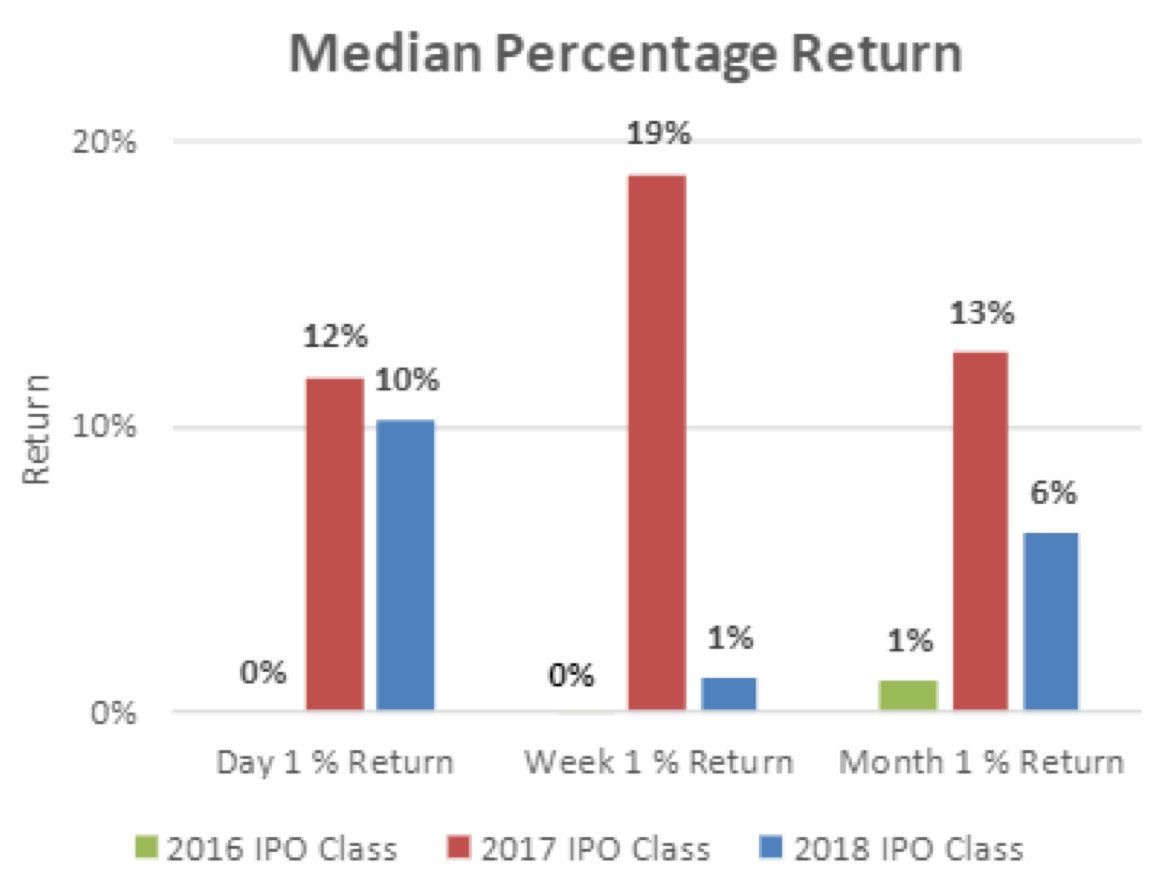
The median percent return tells a favorable story as well, but indicates that upside outliers meaningfully skew the average.
Exhibit 3: Median Percentage Return on Biopharma IPOs

Source: Jefferies
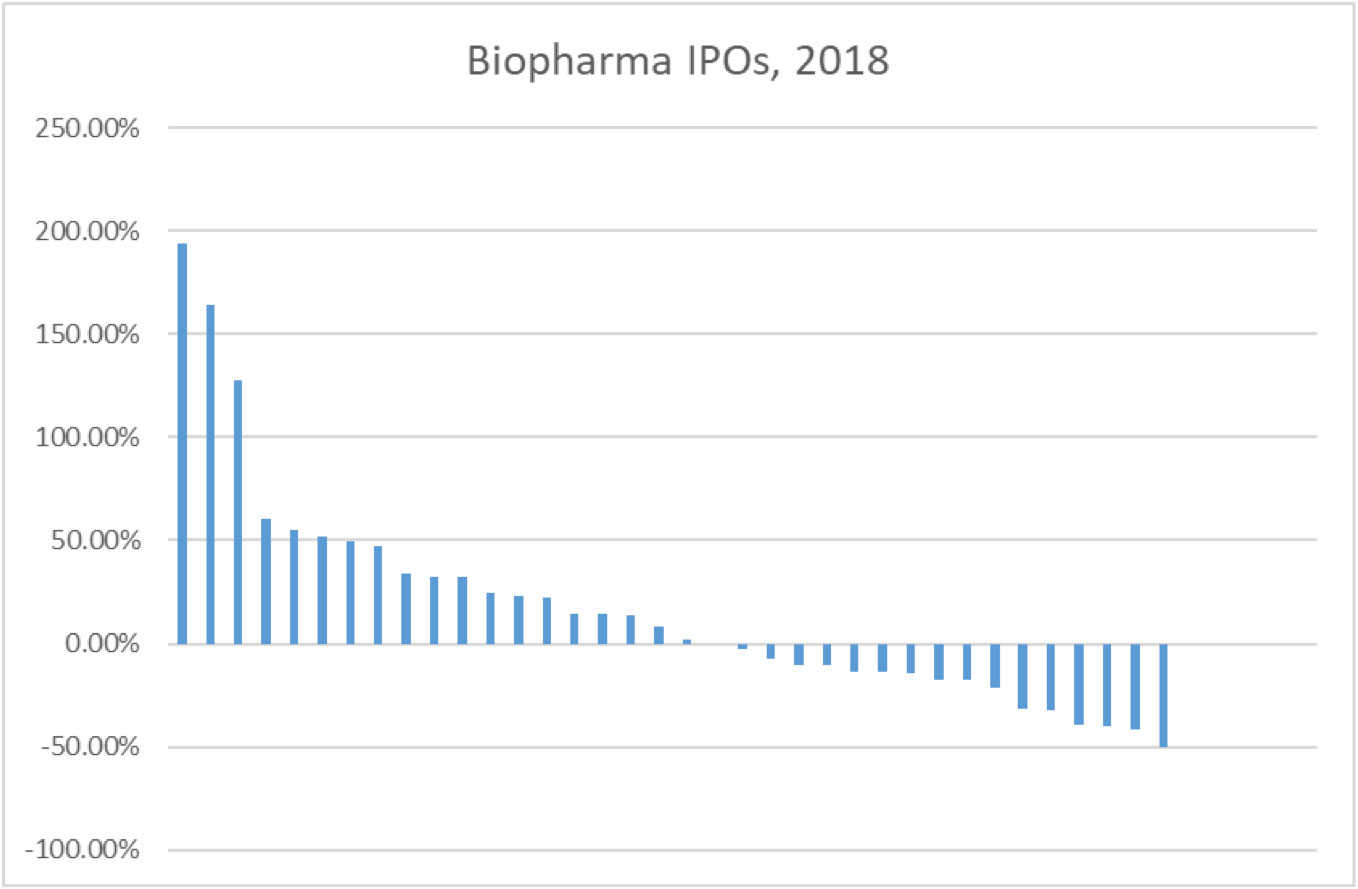
A granular view of initial pricing to-date for 2018 new issues shows three upside outliers (including a takeout), but an otherwise linear distribution from +50% to -50%.
Exhibit 4: Biopharma Initial Pricing To-Date 2018

Source: Driehaus
Those outliers to the upside certainly stand out, however, perhaps more impressive is that multiple companies that have been public for fewer than six months have traded down to cash.
We continue to see opportunities to pick winners and avoid losers in development-stage biopharma, and the data above illustrates that discretion and a clear process for evaluating companies and deals continues to be critical.
This information is not intended to provide investment advice. Nothing herein should be construed as a solicitation, recommendation or an offer to buy, sell or hold any securities, market sectors, other investments or to adopt any investment strategy or strategies. You should assess your own investment needs based on your individual financial circumstances and investment objectives. This material is not intended to be relied upon as a forecast or research. The opinions expressed are those of Driehaus Capital Management LLC (“Driehaus”) as of July 2018 and are subject to change at any time due to changes in market or economic conditions. The information has not been updated since July 2018 and may not reflect recent market activity. The information and opinions contained in this material are derived from proprietary and non-proprietary sources deemed by Driehaus to be reliable and are not necessarily all inclusive. Driehaus does not guarantee the accuracy or completeness of this information. There is no guarantee that any forecasts made will come to pass. Reliance upon information in this material is at the sole discretion of the reader.
Other Commentaries
Data Center
By Ben Olien, CFA
Driehaus Micro Cap Growth Strategy March 2024 Commentary with Attribution
By US Growth Equities Team