Secular growth in Internet data traffic
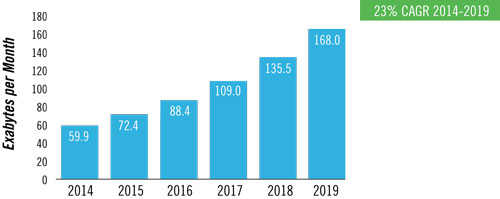
The rapid increase in Internet penetration around the world has resulted in a secular increase in global Internet Protocol (IP) data traffic. While growth rates have decelerated from a decade ago, they remain robust. Current estimates are for Internet traffic to more than double over the next four years, largely driven by consumer adoption of smartphones and increased consumption of media, especially video (Exhibit 1). Smartphones and other Internet-connected devices have yet to hit the saturation point in multiple emerging economies. Additionally, streaming video companies such as Netflix and Amazon are just starting to penetrate geographies outside of developed countries, providing strong tailwinds for continued global IP traffic growth for the next several years.
Exhibit 1: Global IP Traffic Growth may increase three-fold before the end of the decade

Source: Cisco VNI Global IP Forecast 2014-2019
100G upgrade cycle
To address large traffic growth, telecom equipment vendors have introduced hardware with optical components that can transport data at speeds of 100 gigabit per second (100G), compared to older technologies that transported data at 10/40 gigabit per second (10/40G). While 100G is 2.5 times faster than 40G, use of coherent technology allows the number of channels that can be added in a single fiber to be 5 to 10 times greater than its predecessor, making 100G networks significantly faster.
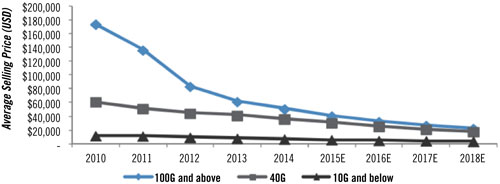
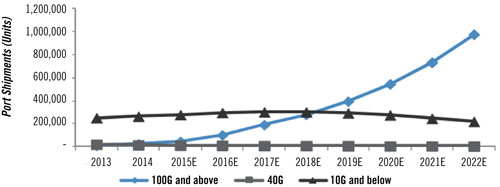
Market adoption of 100G by telecom service providers, large data center operators, and Web 2.0 companies has been slow as optical components to support such high bandwidth have been prohibitively expensive. As recently as a few years ago, on a port-to-port basis, 100G ports were 50% more expensive than 40G ports. However, with the use of advanced materials that enable new manufacturing processes at lower costs, 100G optical component vendors have nearly closed the cost difference (Exhibit 2). Additionally, 100G-based hardware vendors created chassis blade architecture that will allow capacity additions beyond 100G (to 400G) at incrementally lower costs. Due to these factors, rapid growth in 100G port shipments is expected over the next five to six years (Exhibit 3).
Exhibit 2: Cost difference between 100G and 40G ports has nearly closed

Source: Dell’Oro, JP Morgan estimates
Exhibit 3: 100G port shipments are expected to increase dramatically

Source: Dell’Oro, JP Morgan estimates
Select 100G pure play investment opportunities
Service provider capital expenditures remain lackluster and are unlikely to see a material improvement in growth rates. However, we expect their spending to be highly skewed toward building out 100G bandwidth networks, while spending on 10/40G will decline. Additionally, Web 2.0 and large datacenter operators are likely to ramp spending on 100G interconnects materially over the next few years. We have identified multiple companies that have exclusively focused on developing products for building out 100G networks with low exposure to older generation 10/40G. It is our view that these companies are in the early innings of a demand inflection and will see superior growth rates and margin expansion.
This information is not intended to provide investment advice. Nothing herein should be construed as a solicitation, recommendation or an offer to buy, sell or hold any securities, market sectors, other investments or to adopt any investment strategy or strategies. You should assess your own investment needs based on your individual financial circumstances and investment objectives. This material is not intended to be relied upon as a forecast or research. The opinions expressed are those of Driehaus Capital Management LLC (“Driehaus”) as of June 2015 and are subject to change at any time due to changes in market or economic conditions. The information has not been updated since June 2015 and may not reflect recent market activity. The information and opinions contained in this material are derived from proprietary and non-proprietary sources deemed by Driehaus to be reliable and are not necessarily all inclusive. Driehaus does not guarantee the accuracy or completeness of this information. There is no guarantee that any forecasts made will come to pass. Reliance upon information in this material is at the sole discretion of the reader.
Other Commentaries
Data Center
By Ben Olien, CFA
Driehaus Micro Cap Growth Strategy March 2024 Commentary with Attribution
By US Growth Equities Team