You may have heard this from us before, but we think genomics is a really big deal. In this piece we highlight three genomics-related graphics that succinctly illustrate our view that medicine is at the very interesting crossroads of rapidly-advancing technology and vast opportunity.
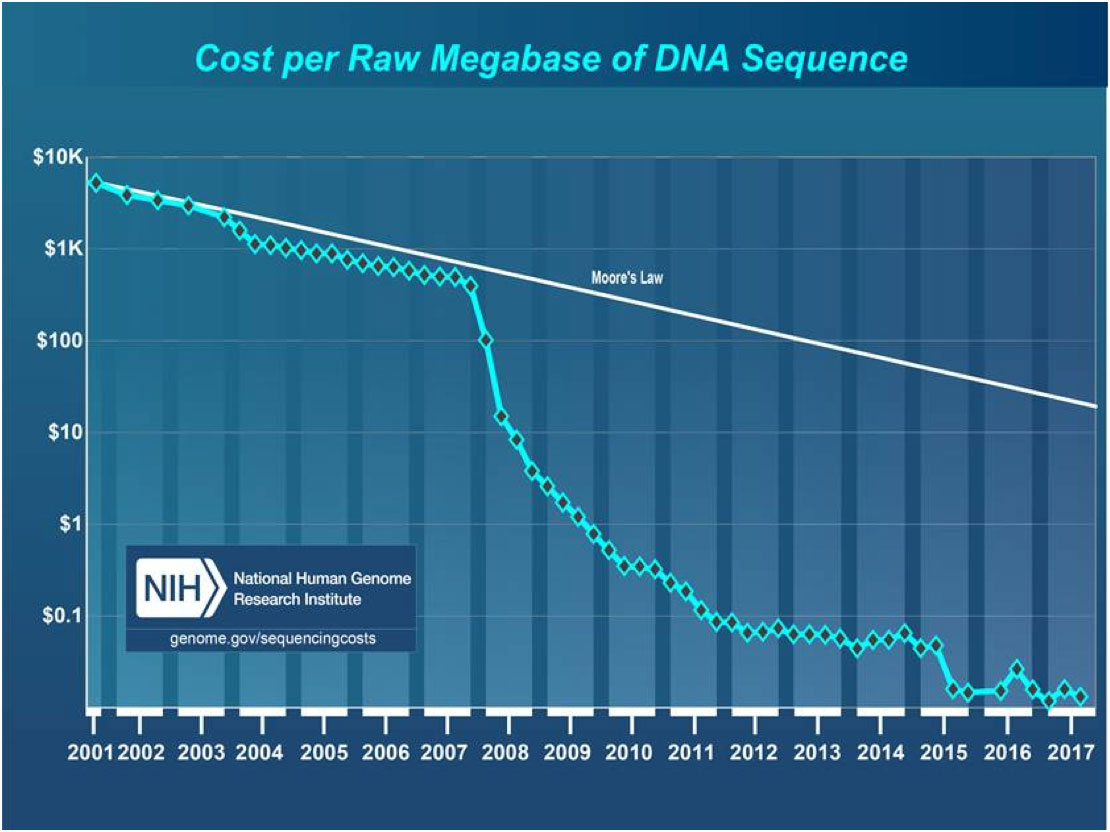
This first chart (Exhibit 1) is one you have no doubt seen before, but the National Institutes of Health are kind enough to update it occasionally, and this is the latest data series (...”latest” meaning since 2017...) on the cost per datapoint to sequence a genome.
Exhibit 1: Sequencing Cost Over Time

Source: National Institutes of Health – National Human Genome Research Institute
What stands out to us about this chart is the scale on the Y-axis (logarithmic) and the slope of the curve from 2007 onwards. The decline looks exponential until one realizes that on a log scale chart an exponential decline would be reflected as a straight line (such as the Moore’s Law reference line). The cost of sequencing has cratered.
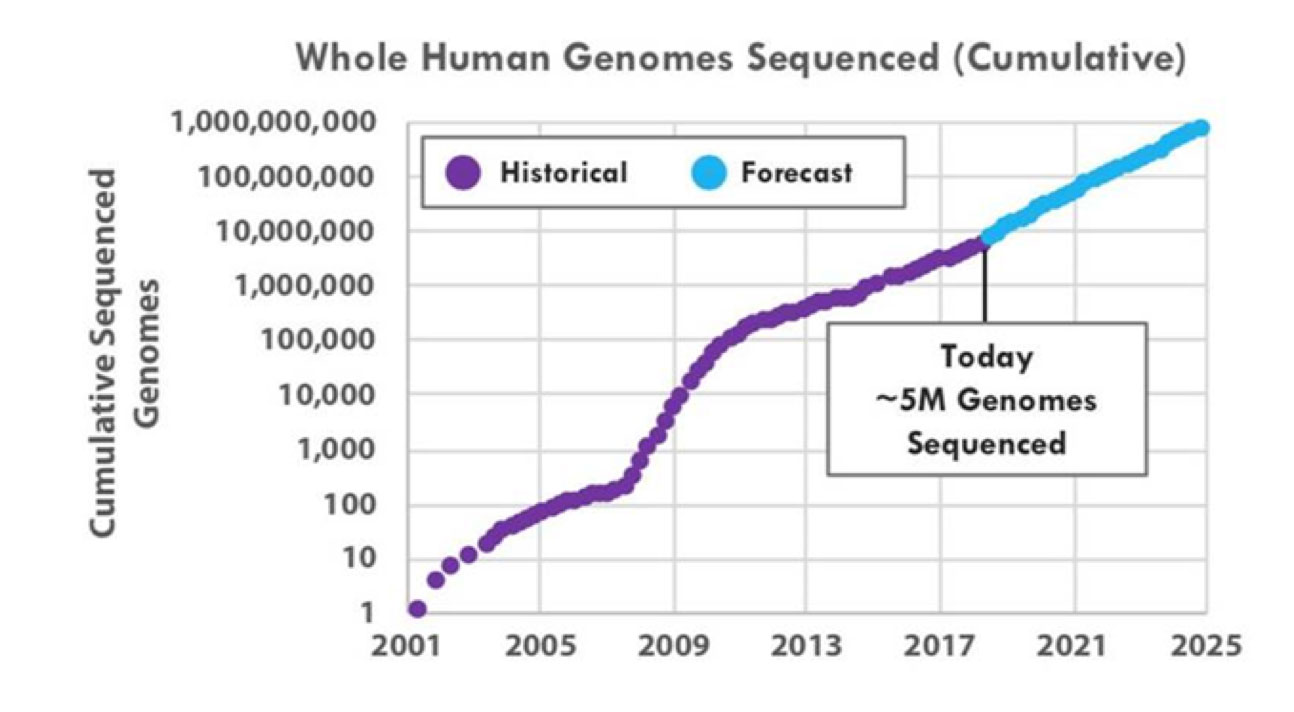
The second graphic (Exhibit 2) shows cumulative volume of sequenced genomes. As you would expect with plummeting cost per genome, the aggregate volume of sequenced genomes is exploding.
Exhibit 2: Cumulative Genomes Sequenced Over Time

Source: ARK Invest
Genomic analysis leans very hard on statistics, and if you remember high school statistics you know that an increase in sample size will result in tighter confidence intervals around the conclusions that can be made, holding all other variables constant. Because the cumulative-genomes sample size is exploding the volume and quality of actionable findings is poised to continue soaring as well.
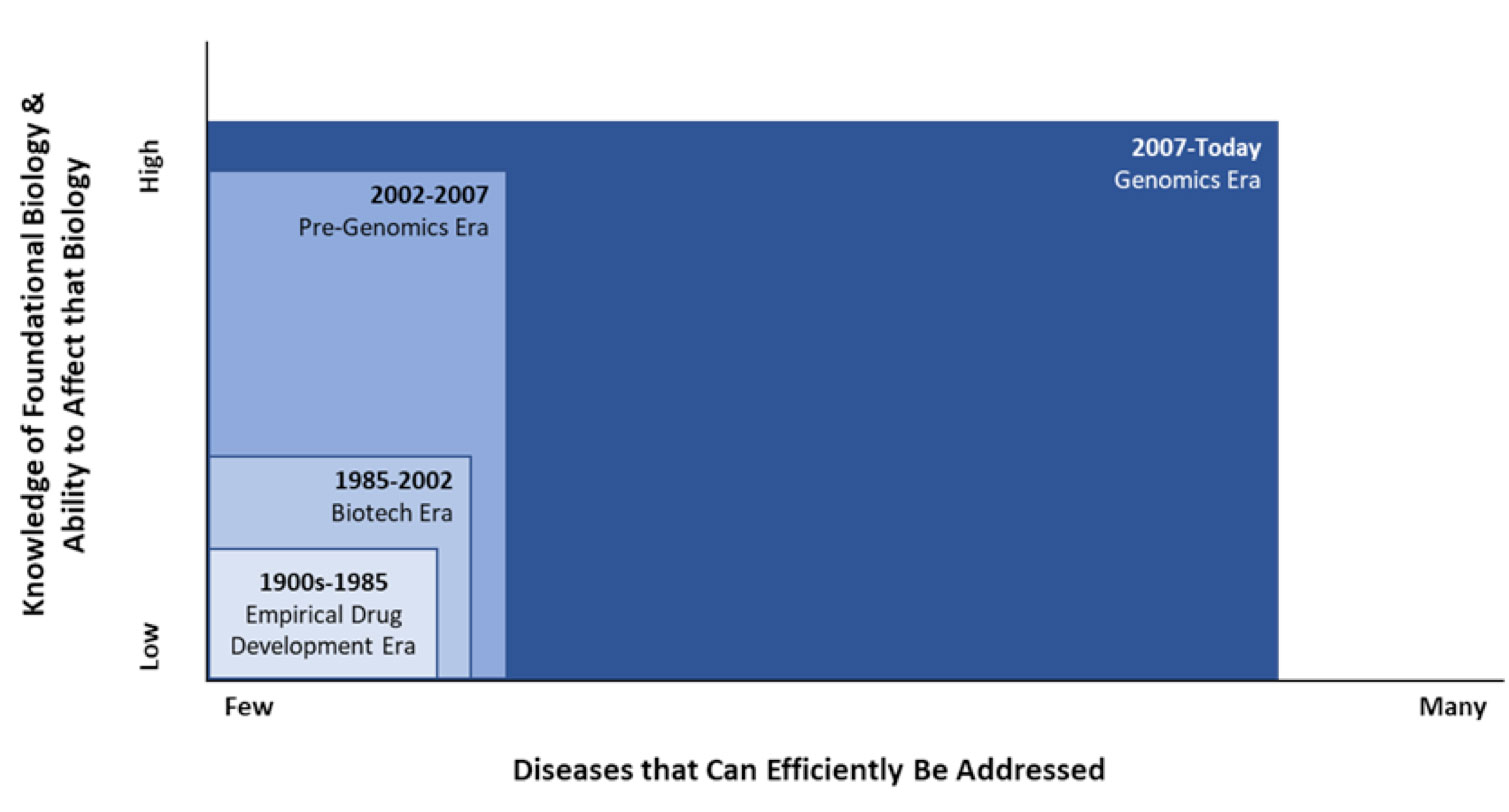
The third graphic (Exhibit 3) illustrates that the opportunity to improve patient outcomes remains vast.
Exhibit 3: Genomics Era

Source: Driehaus Capital Management LLC
This graphic is illustrative only (if you have well-sourced data, please share it with us!), but suggests there is a sizable opportunity within well-characterized diseases. The opportunity in poorly characterized diseases is vastly larger, and we expect that a meaningful amount of the white-space today will be filled in over the next 15-20 years, due to rapidly advancing technologies.
It is still very early days in the incorporation of genomics in drug development, and since the development cycles in this industry are long we expect the grounds to remain fertile for investment for many years!
This information is not intended to provide investment advice. Nothing herein should be construed as a solicitation, recommendation or an offer to buy, sell or hold any securities, market sectors, other investments or to adopt any investment strategy or strategies. You should assess your own investment needs based on your individual financial circumstances and investment objectives. This material is not intended to be relied upon as a forecast or research. The opinions expressed are those of Driehaus Capital Management LLC (“Driehaus”) as of April 2019 and are subject to change at any time due to changes in market or economic conditions. The information has not been updated since April 2019 and may not reflect recent market activity. The information and opinions contained in this material are derived from proprietary and non-proprietary sources deemed by Driehaus to be reliable and are not necessarily all inclusive. Driehaus does not guarantee the accuracy or completeness of this information. There is no guarantee that any forecasts made will come to pass. Reliance upon information in this material is at the sole discretion of the reader.
Other Commentaries
Data Center
By Ben Olien, CFA
Driehaus Micro Cap Growth Strategy March 2024 Commentary with Attribution
By US Growth Equities Team